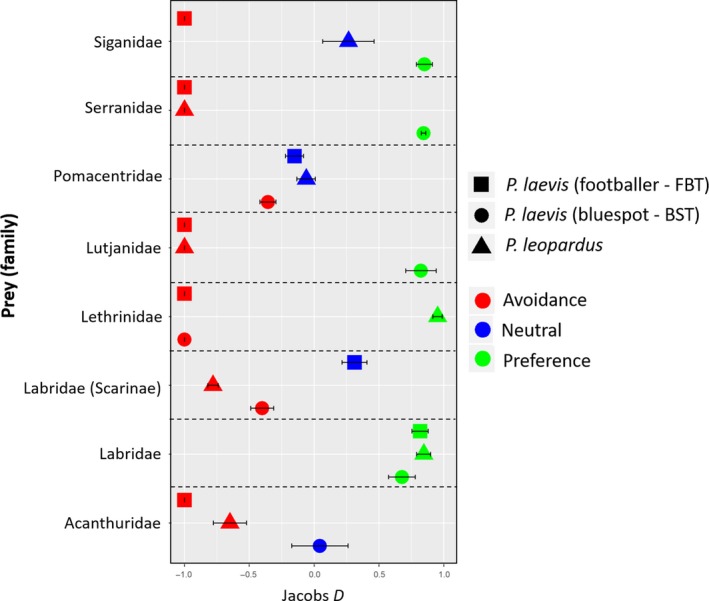
Figure 4.

Summary of resource selection as indicated by Jacobs’ Electivity Index (D) for Plectropomus at TSV reefs. The proportion of prey consumed was calculated using DNA stomach contents and the proportion of prey available was estimated from standardized abundance surveys at four TSV reefs (Helix Reef, Rib Reef, Chicken Reef, and Knife Reef) during 2014 (Bierwagen et al.—in press). The value of D varies from 1 (maximum avoidance) to +1 (maximum preference). Index values of 0 indicate that prey species are consumed in proportion to their abundance. Confidence intervals that fell between −0.25 and +0.25 were deemed to be consumed in proportion to its abundance (i.e., neutral selection)
