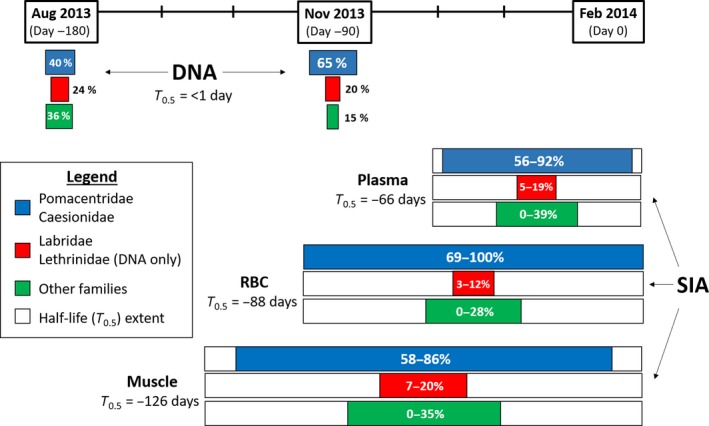
Figure 7.

Interpretive representation of stable isotope turnover (i.e., half‐life, T0.5) and prey composition estimates from mixing models (using 75% credibility intervals) in different tissues of Plectropomus leopardus sampled in February 2014 relative to prey composition based on DNA stomach contents in August and November 2013
