
Figure 5.
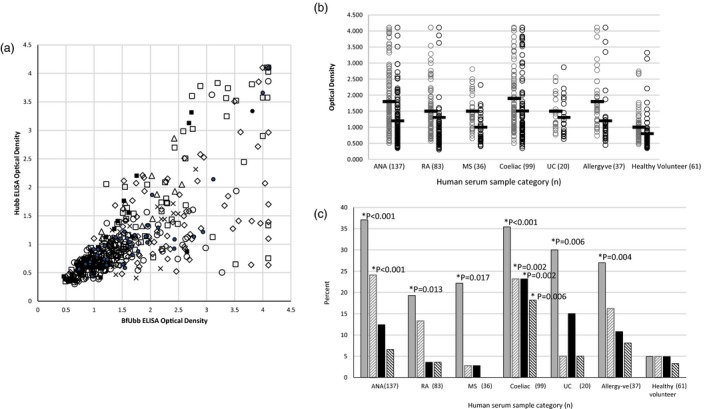
Comparison of immunoglobulin (Ig)G reaction of human serum samples with sBfUbb and Hubb by enzyme‐linked immunosorbent assay (ELISA). (a) Plot of optical density (OD) readings for BfUbb versus Hubb (1/90 serum dilution). Category: autoimmune antibodies (ANA), diamond; rheumatoid arthritis (RA), open circle; multiple sclerosis (MS), x; ulcerative colitis (UC), triangle; coeliac, open square; allergy test negative (allergy–ve), solid circle; healthy volunteer (HV), solid square. (b) Plot of OD reading versus serum category (1/90 serum dilution) for reaction with sBfUbb (grey) and Hubb (black). Bar = mean OD reading. (C) Percentage within sample category (1/90 serum dilution) with an OD > 2 (solid fill) and OD > 2·5 (diagonal stripes); sBfUbb (grey), Hubb (black). *Indicates statistically significant difference with the healthy volunteer samples by Fisher’s exact test (two‐sided).