Figure 1.
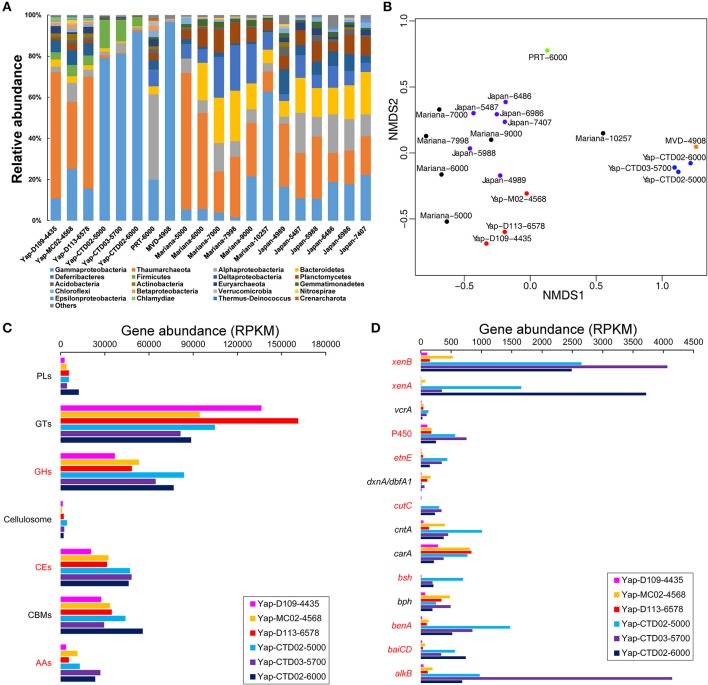
(A) Microbial community compositions of the Yap Trench metagenomes and some reported trench environments as determined by the 16S rRNA genes. Taxonomic assignments of the Yap Trench metagenomes were performed using Metaxa2 (Bengtsson-Palme et al., 2015) based on the identified 16S rRNA gene reads. (B) An NMDS plot showing variations in the microbial community structures of the samples from (A). The distances were determined using the Bray-Curtis method with relative abundances of microorganisms at the phylum/class level. The red and blue filled circles are sediment and seawater samples of the Yap Trench, respectively. The green filled circle is seawater of the Puerto Rico Trench (PRT) (Eloe et al., 2011a). The orange filled circle is seawater of the Matapan-Vavilov Deep (MVD) (Smedile et al., 2013). The black filled circles are seawater of the Mariana Trench (Mariana) (Nunoura et al., 2015). The violet filled circles are seawater of the Japan Trench (Japan) (Nunoura et al., 2016). The numbers at the end of each sample ID indicate sampling depth (mbsl). Relative abundance of the microbial groups in each sample is listed in Table S1. (C,D) Gene abundances involved in the microbial degradation pathways of (C) carbohydrates and (D) hydrocarbons in the six metagenomes of the Yap Trench. AAs, auxiliary activities; CBMs, carbohydrate-binding modules; CEs, carbohydrate esterases; GHs, glycoside hydrolases; GTs, glycosyltransferases; PLs, polysaccharide lyases. alkB, alkane 1-monooxygenase; baiCD, 7α-hydroxy-3-oxo-Δ4-cholenoic acid oxidoreductase; benA, benzoate 1,2-dioxygenase hydroxylase; bph, biphenyl 2,3-dioxygenase; bsh, choloylglycine hydrolase; carA, carbazole 1,9a-dioxygenase; cntA, carnitine monooxygenase; cutC, choline trimethylamine-lyase; dxnA/dbfA1, dibenzofuran dioxygenase; etnE, 2-hydroxypropyl-CoM lyase; P450, cytochrome P450; vcrA, vinyl chloride reductase; xenA, xenobiotic reductase A; xenB, xenobiotic reductase B. The abbreviations in red indicate statistical significant between the three sediment and the three seawater metagenomes (P < 0.05). Detailed information of the gene abundances is listed in Table S2.

