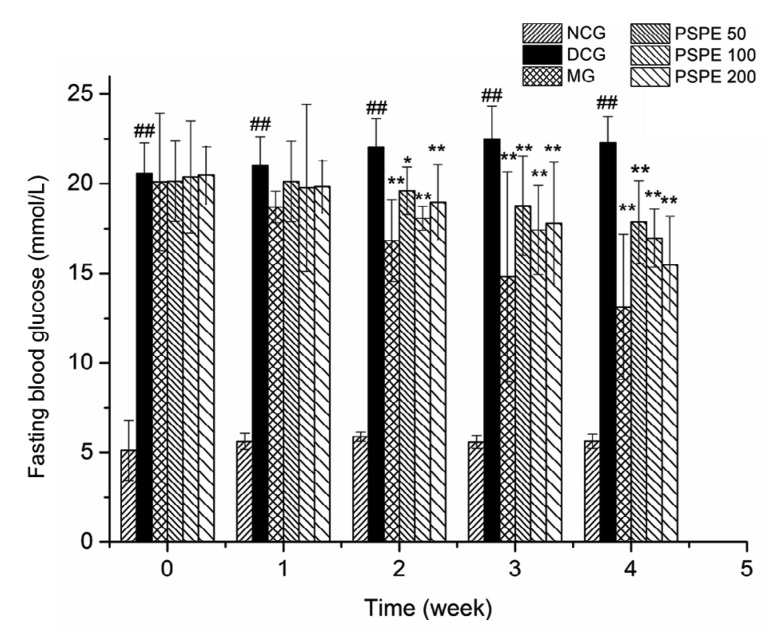
Fig. 2.
Effect of PSPE on fasting blood glucose level in diabetic rats
Results are expressed as the mean±SD (n=7). NCG: normal control group; DCG: diabetic control group; MG: diabetic rats treated with Met (200 mg/kg); PSPE 50: diabetic rats treated with PSPE (50 mg/kg, oral); PSPE 100: diabetic rats treated with PSPE (100 mg/kg, oral); PSPE 200: diabetic rats treated with PSPE (200 mg/kg, oral). ## P<0.01, compared with NCG; * P<0.05, ** P<0.01, compared with DCG

