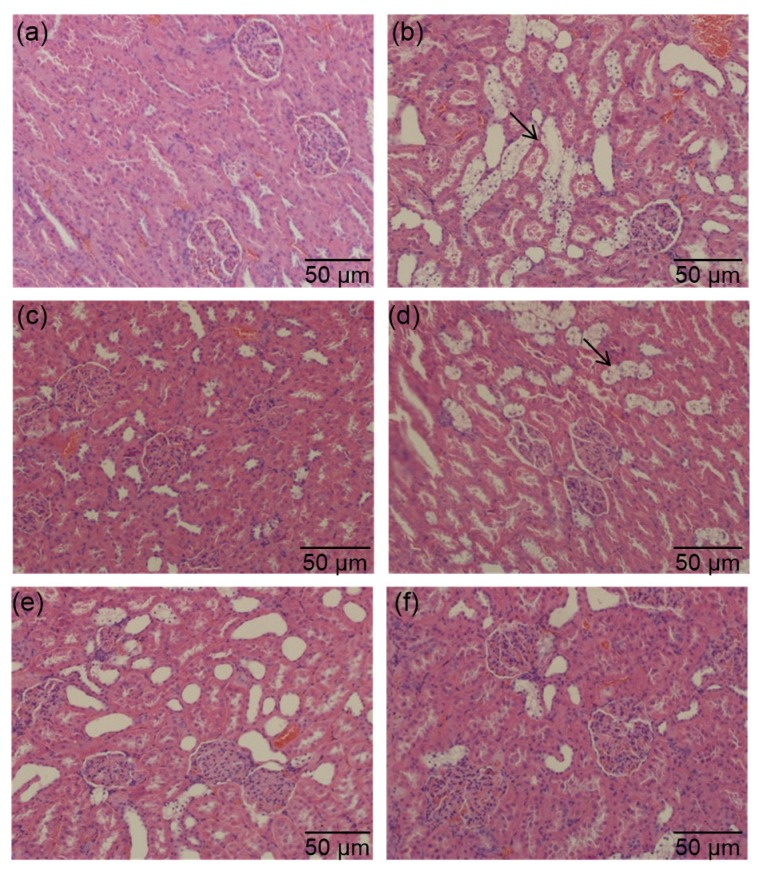
Fig. 5.
Effects of PSPE on morphological changes of kidneys in diabetic rats
(a) Normal control group; (b) Diabetic control group; (c) Diabetic rats treated with Met (200 mg/kg); (d) Diabetic rats treated with PSPE (50 mg/kg); (e) Diabetic rats treated with PSPE (100 mg/kg); (f) Diabetic rats treated with PSPE (200 mg/kg). Arrows: glomeruli with mesangiocapillary proliferation

