Figure 1.

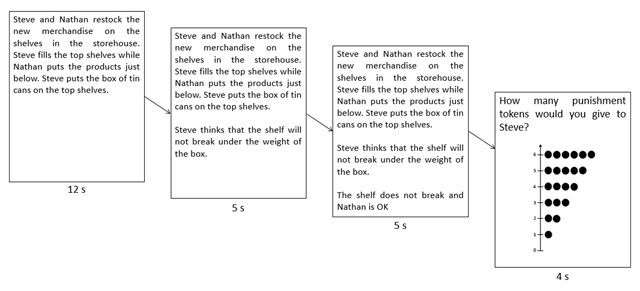
Illustration of the presentation of the vignettes in three cumulative segments, the question and the response scale given to the participants.

Illustration of the presentation of the vignettes in three cumulative segments, the question and the response scale given to the participants.