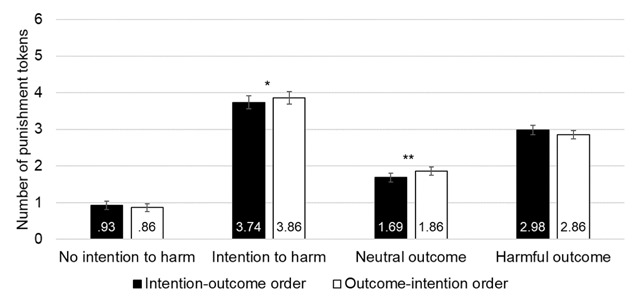
Figure 2.

Results of Experiment 1. Mean number of punishment tokens attributed (0 ‘Not punished’ to 6 ‘Strongly punished’) as a function of the order in which the information was presented (intention-outcome order vs. outcome-intention order), the intention (no intention to harm vs. intention to harm) and the outcome (neutral outcome vs. harmful outcome). Error bars represent standard mean error. (*) = p < .10; * = p < .05; ** = p < .01.
