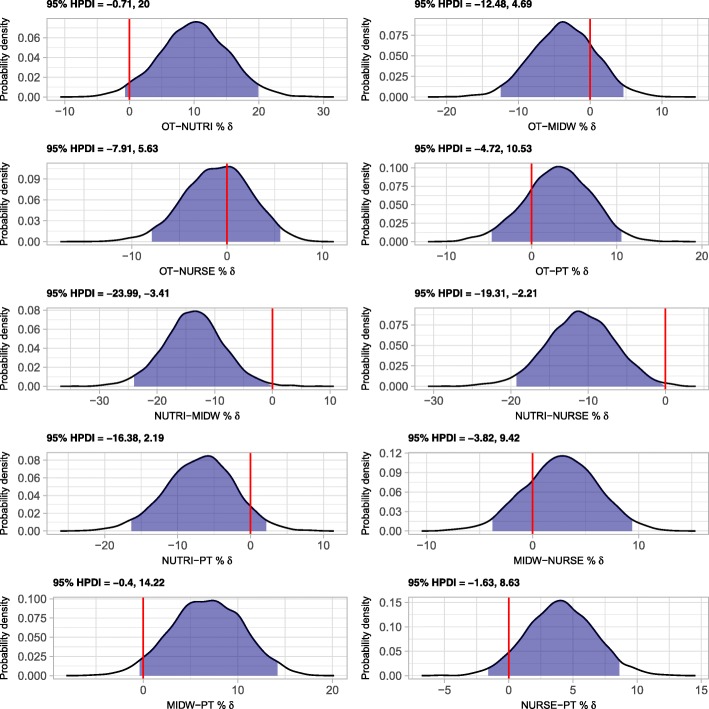
Fig. 1.
Probability density of differences in adjusted yearly prevalences of low back pain among health professions’ students. 95% HPDI: 95% highest posterior density interval. Source: Nat-ABBE coordination group, National Graduate Survey of Health Professionals from Universities of Applied Sciences 2016, 2017

