Fig. 2.

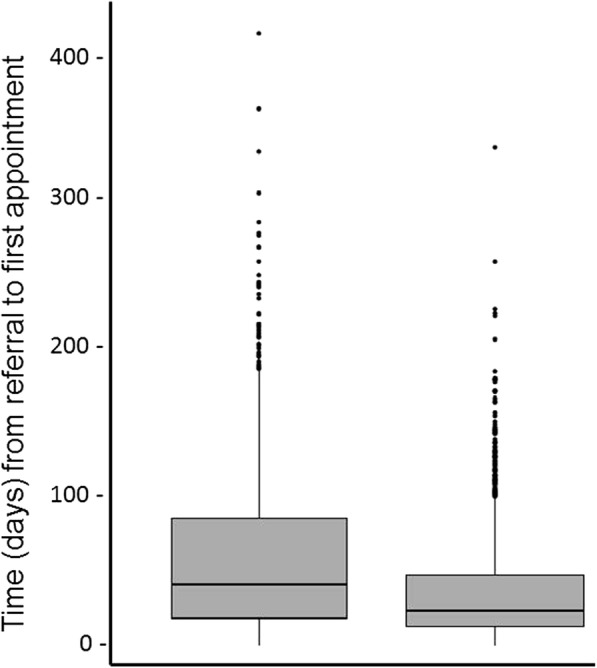
Waiting time for control (left) and intervention (right) periods. Median represented by bar, 25th and 75th percentiles represented by box and upper and lower quartiles represented by whiskers

Waiting time for control (left) and intervention (right) periods. Median represented by bar, 25th and 75th percentiles represented by box and upper and lower quartiles represented by whiskers