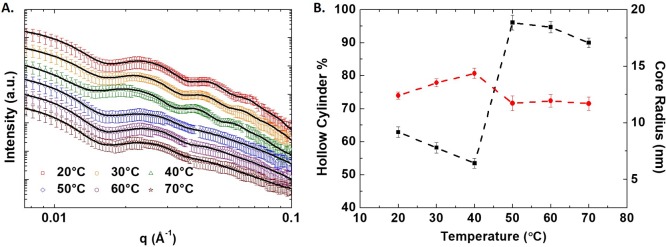
Figure 7.
(A) SAXS patterns of BTA 3 (c = 6 mg/mL) in water as a function of temperature. The open symbols represent the experimental data where squares, circles, triangles, diamonds, hexagons, and stars represent 20, 30, 40, 50, 60, and 70 °C and the solid line represents the best fit results. (B) Volume fraction (closed square) and core radius (closed circle) of BTA 3 as a function of temperature. The dashed lines are point-to-point guidelines.

