Figure 3.
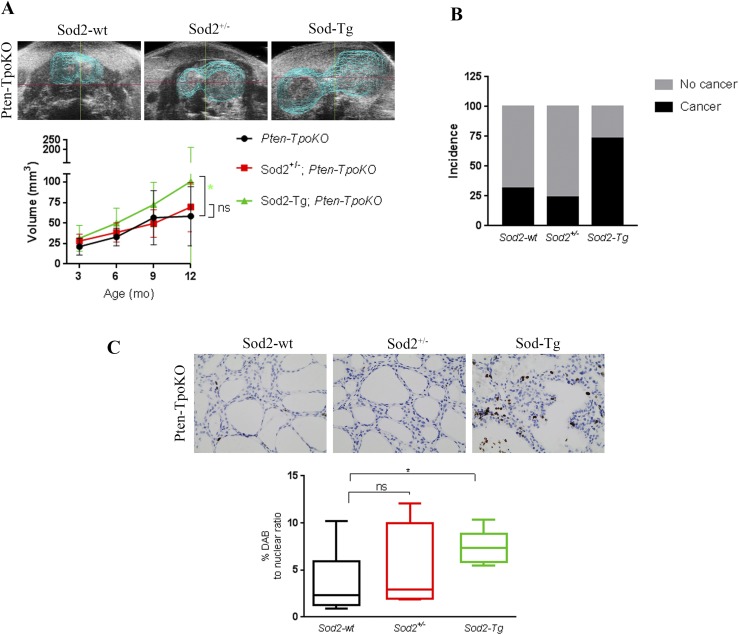
Sod2 overexpression increases tumor aggressiveness in a Pten KO mouse model of FA. (A, top) Three-dimensional rendering of ultrasonographic images of Pten-TpoKO with Sod2-wt, Sod2+/− and Sod2-Tg at 12 months. (A, bottom) Average thyroid volumes determined by three-dimensional ultrasonography at 3, 6, 9, and 12 mos in Pten-TpoKO mice with Sod2-wt (black line; n = 12), Sod2+/− (red line; n = 22), and Sod2-Tg (green line; n = 18). (B) The incidence of thyroid carcinoma in Pten-TpoKO mice with Sod2-wt, Sod2+/−, and Sod2-Tg. (C, top) Representative ×40 images of Ki67 staining in thyroid tumors of mice at 12 mos of age. (C, bottom) Quantification of proliferation represented as percent DAB to nuclear ratio. Graphs present mean data ± SD. *P ≤ 0.05. DAB, diaminobenzidine.

