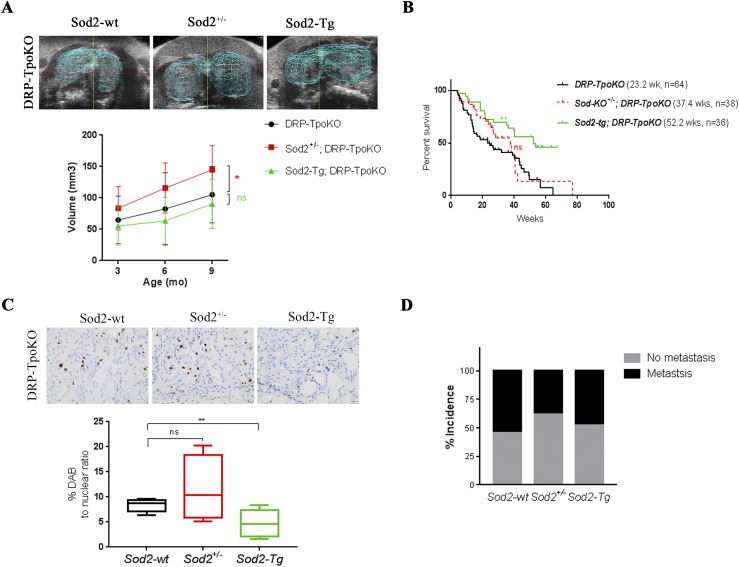
Figure 4.
Sod2 deficiency induces tumor growth in a dual Pten/Prkar1a KO mouse model of metastatic FTC. (A, top) Three-dimensional rendering of ultrasonographic images of thyroid glands in DRP-TpoKO with Sod2-wt, Sod2+/−, and Sod2-Tg mice at 12 mos. (A, bottom) Average thyroid volumes determined by three-dimensional ultrasonography at 3, 6, 9, and 12 mos in DRP-TpoKO mice with Sod2-wt (black line; n = 16), Sod2+/− (red line; n = 12), and Sod2-Tg (green line; n = 20). (B) Kaplan-Meier survival curves of DRP-TpoKO mice with Sod2-wt (black line), Sod2 deficiency (red line), and Sod2 overexpression (green line). (C, top) Representative ×40 images of Ki67 staining in thyroid tumors of mice at 12 mos of age. (C, bottom) Quantification of proliferation represented as percent DAB to nuclear ratio. (D) Percent incidence of lung metastases in DRP-TpoKO mice with Sod2-wt, Sod2+/−, and Sod2-Tg. *P ≤ 0.05; **P ≤ 0.01. DAB, diaminobenzidine.

