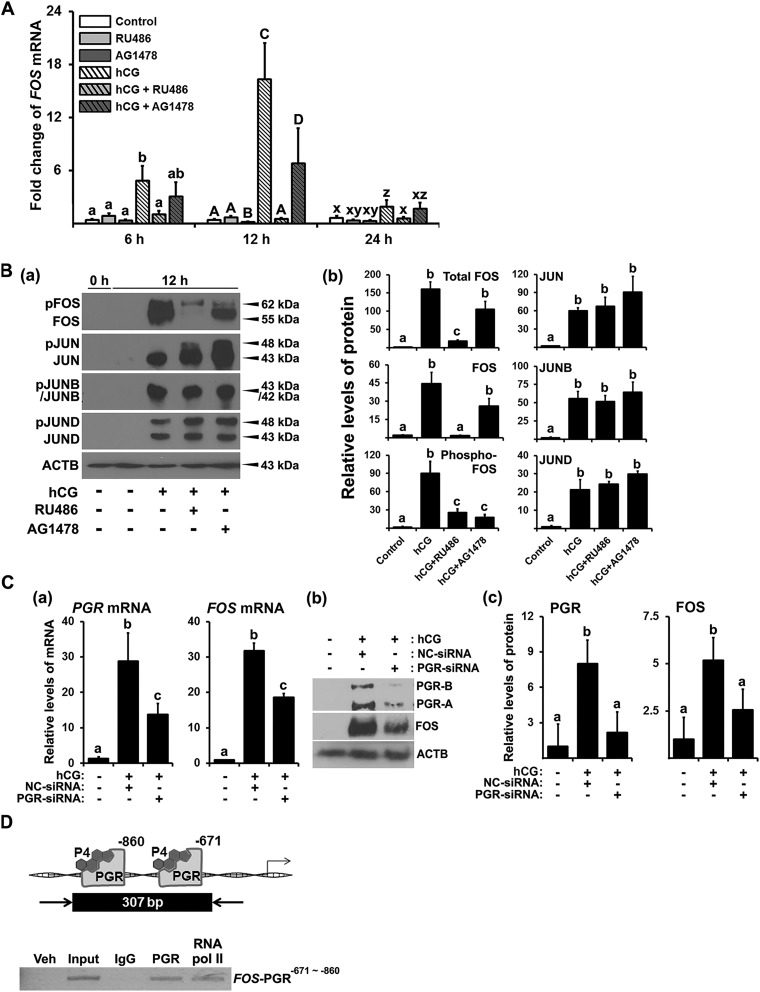
Figure 3.
The effects of antiprogestin, EGFR tyrosine kinase inhibitor, and PGR silencing RNA on the expression of FOS and Jun family members and binding of PGR to the FOS promoter region in hGLCs. (A) Primary hGLCs were treated with or without RU486 (progesterone receptor antagonist, 20 µM) or AG1478 (EGFR tyrosine kinase inhibitor, 10 µM) in the absence or presence of hCG (1 IU/mL) for 6, 12, or 24 h. The levels of mRNA for FOS were measured by quantitative PCR (qPCR) and normalized to those of RNA18S5 mRNA in each sample (n = 4 to 6 independent experiments). Bars with no common superscripts in each time point are significantly different (P < 0.05). (B) FOS, JUN, JUNB, and JUND were detected by Western blots. The membrane was reprobed with a monoclonal antibody against ACTB to assess the loading of protein in each lane. The band intensities for each protein were measured by ImageJ and normalized to the intensity of β-actin (ACTB) in the corresponding sample. The experiments were repeated three times with independent samples. (C) (a) The hGLCs were treated with or without hCG (1 IU/mL) in the presence of negative control (NC) or PGR silencing RNA for 10 h. The levels of mRNA for PGR and FOS were measured by qPCR and normalized to those of RNA18S5 mRNA in each sample (n = 4 independent experiments). (b) Proteins for PGR, FOS, and ACTB were detected by Western blots. (c) The band intensities for each protein were measured by ImageJ and normalized to the intensity of β-actin (ACTB) in the corresponding sample. Bars with no common superscripts in each time point are significantly different (P < 0.05). (D) Binding of PGR to the FOS promoter region was assessed by ChIP assay using hGLCs treated with hCG (1 IU/mL) for 12 h. Sheared DNA fragments immunoprecipitated with PGR antibody, RNA polymerase II antibody, or IgG and input DNA were analyzed using primer pairs specific to promoter regions of the FOS gene and represented as arrows. Amplified DNA fragments containing PGR responsive elements are represented as a black box with the indicated PCR product size. Experiments were repeated three times, each with independent patient samples. bp, base pair; veh, vehicle.

