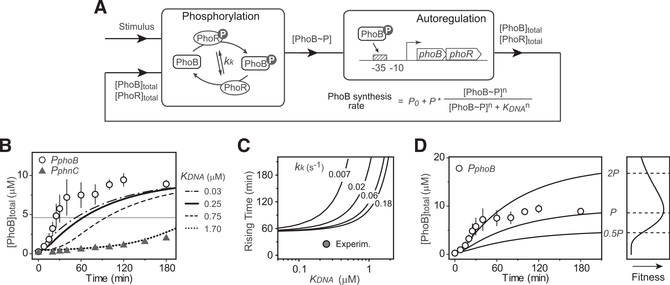
Figure 2. Effects of TF DNA-Binding Affinity and Promoter Strength on PhoB Expression Kinetics.
(A) Phosphorylation and transcription feedbackmodules for the autoregulation model (see details in Figure S1).
(B) Slower PhoB kinetics caused by weaker DNA affinity. PhoB expression kinetics modeled with different affinities are shown in curves. The solid and dotted curves were modeled with the affinities of PhoB~P to the phoB (KDNA = 0.25 mM) and phnC (KDNA = 1.7 μM) promoters. Affinities were measured by EMSAs (Figure S2). The horizontal line indicates the half-maximal PhoB level. Symbols represent PhoB expression kinetics experimentally measured (Figure S3) for RU1878 (PphoB) and RU1881 (PphnC). Data are shown as mean ± SD from five (PphoB) or four (PphnC) experiments. RU1881 is engineered to express phoBR from the phnC promoter. RU1878 and RU1881 have identical genetic backgrounds. The WT phoBR operon in RU1878 is not at its original location; however, RU1878 displayed identical expression kinetics as the WT strain BW25113 (Figure S3).
(C) Dependence of rising time on promoter affinity. Rising time was calculated as the time required to reach the half-maximal PhoB level, 4.7 μM. Solid curves indicate the rising times calculated with different values of the autophosphorylation kinetics parameter kk. WT has a kk of 0.06 s−1.
(D) Effects of promoter strength on autoregulation kinetics and fitness. Solid lines represent modeled data with indicated promoter strengths. The value of P is set at 20 × P0. Open circles show the experimental data for RU1878, as in (B). The curve in the fitness sub-panel is simulated with a log-normal curve that illustrates the fitness trend of previous data (Gao and Stock, 2013a).

