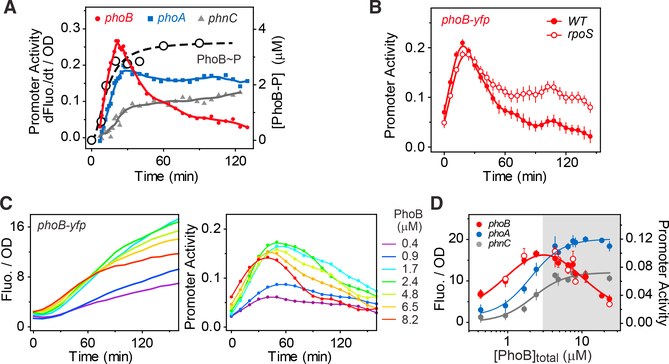
Figure 3. Auto-repression of the phoB Promoter.
(A) Repression of phoB promoter activity during the late stage of Pi starvation. Net promoter activities of phoB-yfp (pJZG202), phoA-yfp (pRG161), and phnC-yfp (pRG162) were assayed in the WT strain BW25113 and calculated as the first derivatives of fluorescence. Solid symbols show the average of 11 individual wells and solid lines illustrate the smoothed data. Open circles with a dashed line show the phosphorylation kinetics measured previously (Gao et al., 2017).
(B) Repression of phoB-yfp in the rpoS deletion strain RU1646. Promoter activity data are shown as mean ± SD from 22 individual wells.
(C) Dependence of phoB repression on PhoB levels. Reporter dynamics were measured in the non-autoregulatory strains RU1616 or RU1783 at different IPTG concentrations that yield the indicated PhoB levels. Time zero represents the onset time of Pi starvation. One representative sample for each indicated PhoB level is shown.
(D) Dependence of reporter output on PhoB expression levels. Promoter activity of phoB-yfp (open circles) and OD-normalized fluorescence of three YFP reporters (solid symbols) were measured at 90 min after the onset of starvation and plotted against PhoB concentrations. The shaded area indicates the PhoB concentration range that displayed phoB promoter repression. Data are shown as mean ± SD from at least four independent experiments.

