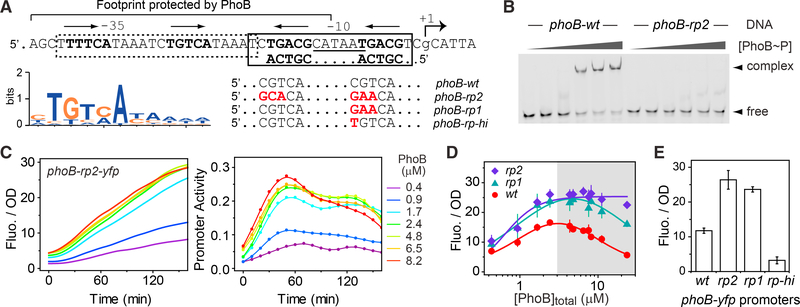
Figure 4. Identification of an Auto-repression Site in the phoB Promoter.
(A) Illustration of PhoBP binding sites. Sequence of the phoB promoter region is shown with the 35, 10, and transcription start (+1) labeled. The dotted box indicates the PhoB activation site, Pho box. Bold letters mark the highly conserved sequence tracts for major groove binding and the arrows above indicate the orientation of the tandem half-sites. The sequence logo of the half-site was generated with the position-weighted matrix that was used for identification of PhoBbinding sites. An additional site (solid box) was identified on the antisense strand and the reverse complementary sequence is shown. Sequence alignments show the major groove sites of WT as well as mutants designed to disrupt (rp2 and rp1) or enhance (rp-hi) the binding of PhoB~P to the newly identified site.
(B) Binding of PhoB~P to the repression site. EMSA was done using the indicated DNA fragments with PhoB~P concentrations at 0, 1, 2.1, 4.2, 6.3, and 8.4 mM, analyzed in successive lanes from left to right.
(C–E) Correlation of phoB repression with mutations in the PhoB-binding site. Reporter activities of phoB-rp2-yfp (pRG368), phoB-rp1-yfp (pRG369), and phoBrp-hi-yfp) (pRG367) were examined in the non-autoregulatory strains RU1616 or RU1783 at the indicated PhoB levels. OD-normalized fluorescence and promoter activities of phoB-rp2-yfp following the onset of Pi starvation are shown for a representative experiment (C). OD-normalized fluorescence at 90 min after the onset of starvation are shown in (D) across different PhoB levels and in (E) at a concentration of 8.2 mM, a level close to the WT level under Pi-depleted conditions. Data in (D) and (E) are shown as mean ± SD from at least four independent experiments.

