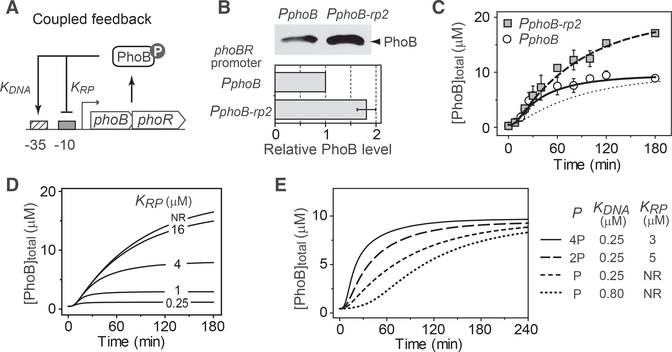
Figure 5. Acceleration of Response Kinetics with Coupled Negative Feedback.
(A) Schematic diagram of the coupled feedback with both activation and repression sites in the same promoter.
(B) Increased PhoB expression in the repression mutant. PhoB expression levels 3 hr after the onset of starvation were quantitated by immunoblotting for the repression mutant strain RU1879 (PphoB-rp2) and the corresponding WT strain RU1878 (PphoB). Average and SD from eight experiments are shown.
(C) Recapitulation of PhoB autoregulation kinetics with the coupled feedback model. Experimentally measured PhoB expression kinetics for the WT and mutant autoregulatory strains are shown in circles and squares as average and SD from at least three experiments (details in Figure S3). The dotted line indicates kinetics that are modeled with the promoter strength parameter, P, valued at 20 × P0 without any repression. The other two lines are modeled with P valued at 41 × P0 without (dashed line) or with (solid line) the coupled negative feedback.
(D) Relationship of PhoB expression to the affinity of PhoB for the repression site. All curves are modeled with the value of KDNA at 0.25 μM and the value of P at 41 × P0.
(E) Adjustment of the autoregulation kinetics with the coupled feedback. Parameters for the modeled curves are selected to produce comparable steady-state PhoB expression levels. NR, no repression.

