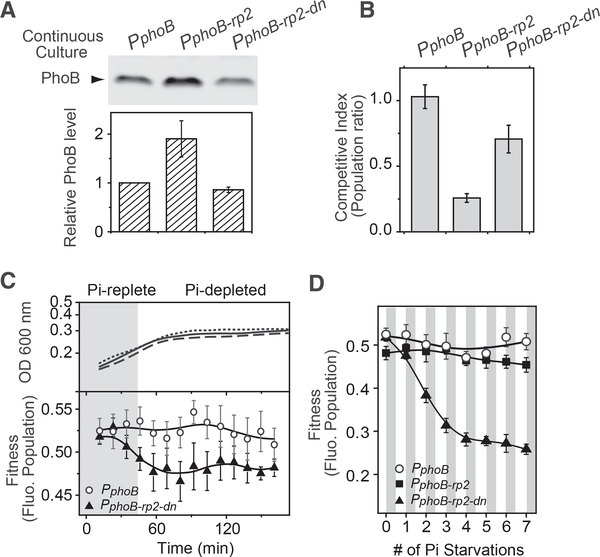
Figure 6. Superior Fitness of the WT Strain with Coupled Feedback.
(A and B) Steady-state expression levels of PhoB (A) and fitness (B) of autoregulatory variants in Pi-depleted continuous cultures. Levels of PhoB in RU1878 (PphoB), RU1879 (PphoB-rp2), and the RU1879-derivative, RU1880 (PphoB-rp2-dn, see details in Figure S5) were quantitated by immunoblotting. Levels of PhoB in the mutant strains were determined relative to that in RU1878 and data are shown as mean ± SD from four independent experiments. The three above strains carrying a CFP-expressing plasmid pRG411 were competed against RU1878 carrying pRG426, which expresses a non-fluorescent CFP variant. Fluorescent bacterial populations were quantified using a thresholding algorithm (Figure S6). Fitness was calculated as the ratio of the fluorescent bacterial population after competition over the population before competition.
(C and D) Bacterial competition in batch cultures. Indicated strains carrying a CFP-expressing plasmid pRG411 were competed against RU1878/pRG426 in batch cultures with a starting Pi concentration at 50 μM. Shaded areas illustrate the approximate range when Pi is replete; however the exact boundary, or the exact time of onset of Pi starvation, has not been determined. Solid, dashed and dotted lines show the growth curves of RU1878, RU1879 and RU1880, respectively. Fluorescent bacteria populations are shown as mean ± SD from eight individual cultures for one starvation (C) or multiple consecutive starvations (D). For consecutive starvations, fluorescent populations at 150 min after each round of inoculation into media containing 50 mM Pi were used for the plot.

