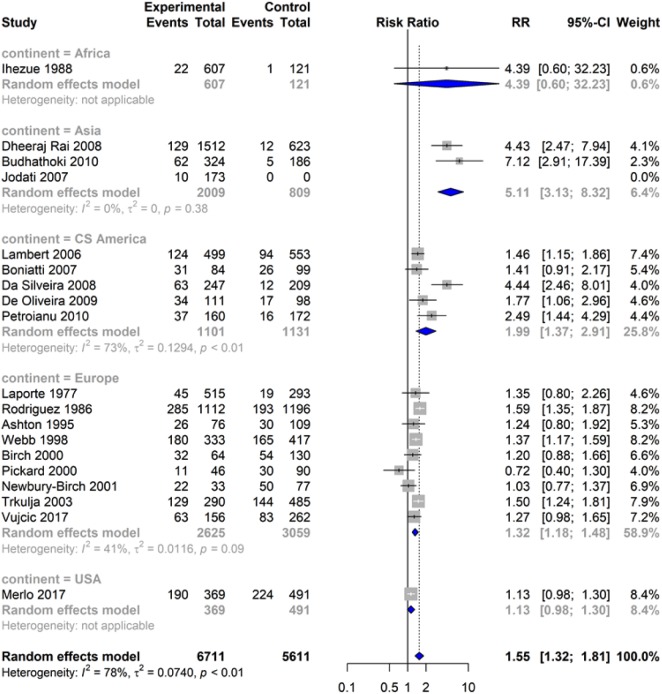
Figure 3.
Forest plot of pooled relative risk for sex of medical students for cannabis use by continent. Male medical students are referred as the experimental group and female students as the control group. The “Events” refer to the number of cannabis users, and “Total” refers the total number of males or females of the study. Black squares represent the relative risk of each study. The area of the square is proportional to weight of the study, which contributes to the pooled relative risk (calculated using the Mantel-Haenszel method). Horizontal lines show 95% confidence intervals. The diamond shows the pooled results and its width the 95% confidence interval. Between-study heterogeneity is represented by I2. The vertical dashed line indicates the overall pooled relative risk.

