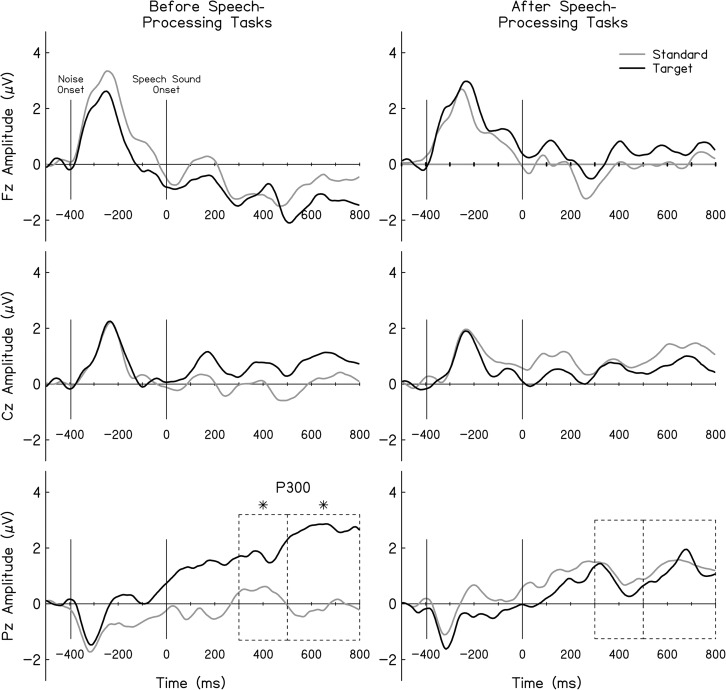
Figure 2.
Averaged auditory-evoked potential (AEP) responses at Fz, Cz, and Pz electrode clusters recorded prior to and following completion of the speech-processing tasks. Dark and light tracings represent AEP responses to the target and standard stimuli, respectively. Dashed boxes highlight time windows used in the analyses. Asterisks indicate time windows where significant changes were observed between test stimuli.

