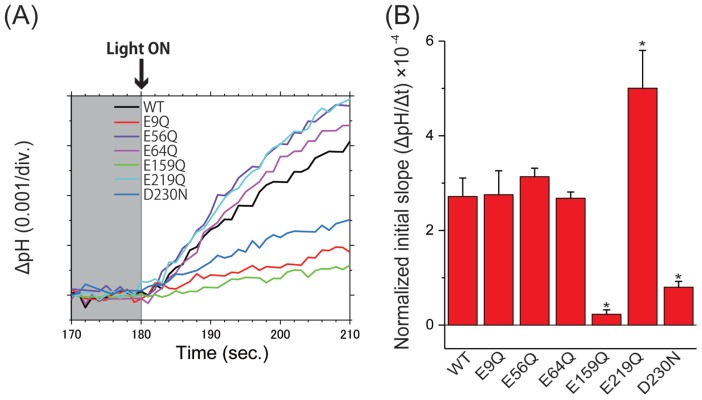
Figure 3.
Comparison of anion transport activity of wild-type ACR2 and its mutants. (A) Light-induced pH changes of wild-type ACR2 and its mutants in the presence of CCCP. The pH values are offset by the initial pH values. (B) Comparison of the anion transport activity of wild-type ACR2 and its mutants. The initial slope amplitudes of the light-induced pH changes, which were obtained from the data in Panel A, were normalized with the band intensities of the western blotting analysis (Fig. 2A) as an index of the protein expression level. All error bars represent the SEM of more than three independent measurements. Asterisks (*) indicate a significant difference from the wild-type (P<0.05; Dunnett’s test).

