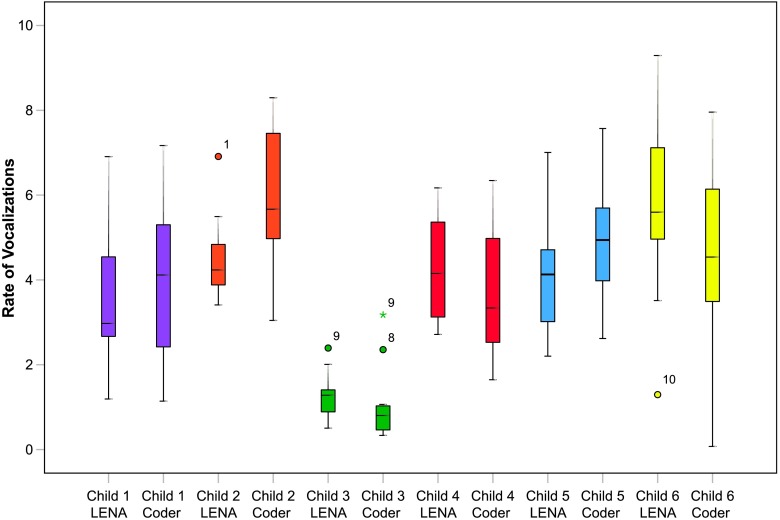
Figure 1.
Boxplot distributions of LENA count and human transcriber count across 14 sessions. The dots indicate sessions with outlying rates of vocalizations, whereas the asterisks are extreme outliers that are three times the interquartile range from the median. For example, Session 9 for Child 3 had an outlying rate of vocalizations for both the LENA system and the human transcriber. LENA = Language Environment Analysis.

