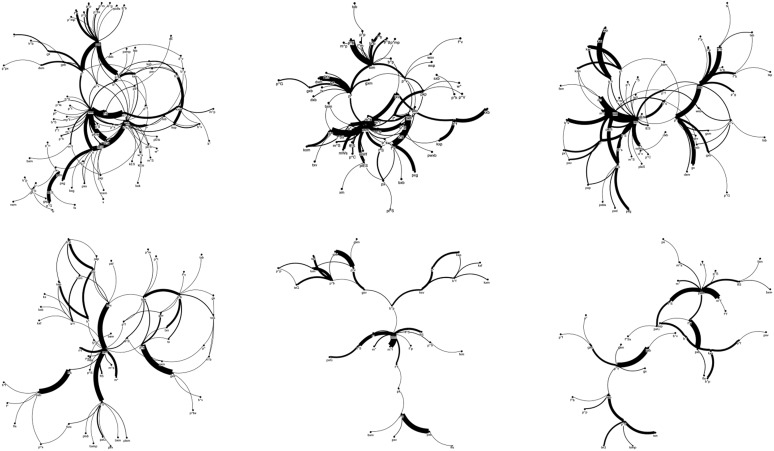
Figure 6.
Network visualizations for the group with developmental language disorder (top) and the typically developing group (bottom). Nodes correspond with the syllable sequence, and edges are depicted as the lines connecting nodes when two nodes were produced in succession. A thicker line indicates a more frequent pattern of production. Sessions 1–3 appear from left to right. Networks of children with developmental language disorder have more different syllables (nodes) and more different productions (edges).

