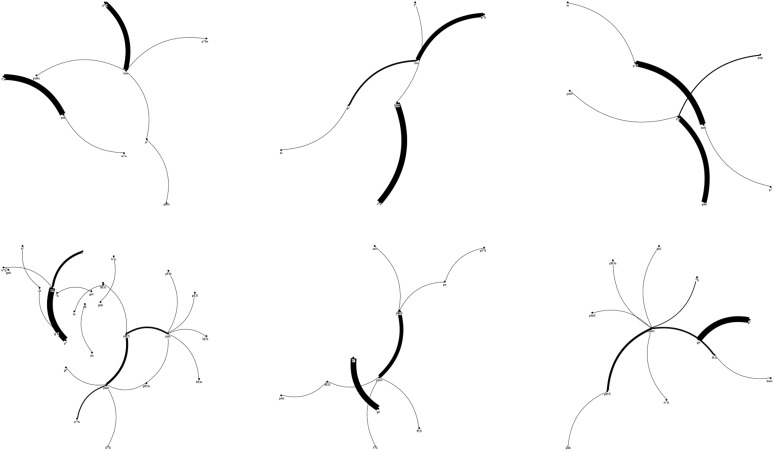
Figure 7.
Two children in the group with developmental language disorder with typical performance on the Bankson-Bernthal Test of Phonology: Participants 1 (top) and 2 (bottom). Nodes correspond with the syllable sequence, and edges are depicted as the lines connecting nodes when two nodes were produced in succession. A thicker line indicates a more frequent pattern of production. Note that neither child stabilized on a single production with both showing multiple variations of the same form. Sessions 1–3 appear from left to right.

