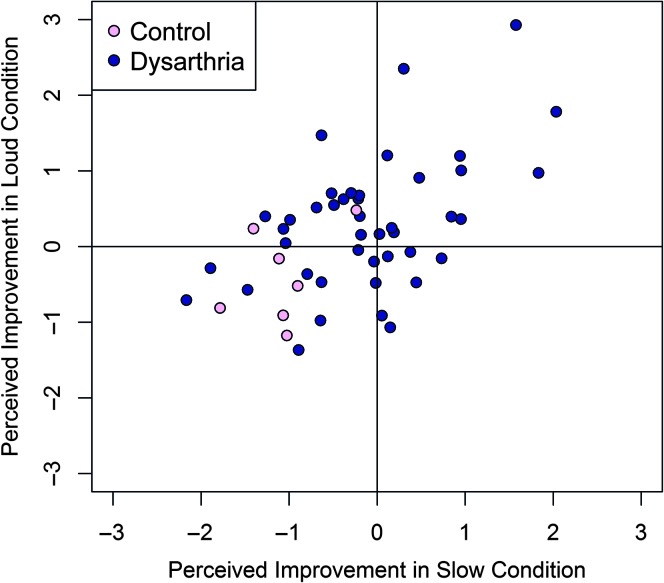
Figure 2.
Perceived improvement in loud and slow speaking conditions. The origin (zero) indicates the speaker had the same average intelligibility rating across the habitual and treatment conditions. The x- and y-axes indicate the number of standard deviations of intelligibility change that occurred from this point.

