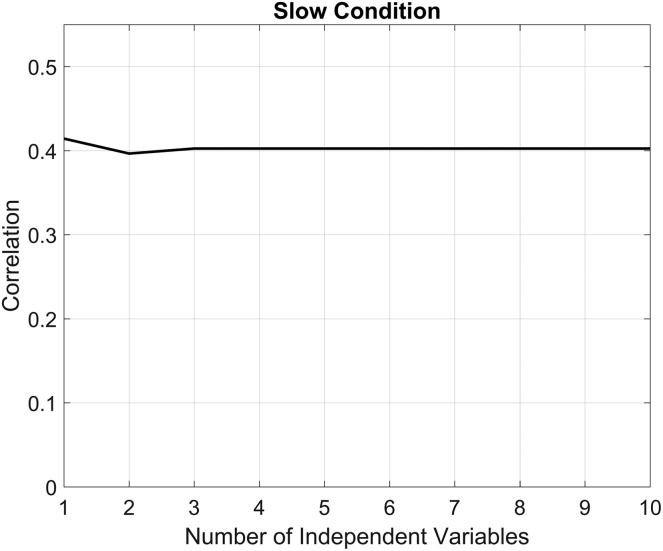
Figure 1.
The predictive power of manual acoustic/perceptual measurements. The y-axis depicts the correlation between the intelligibility gain predicted by the models' output and the true intelligibility gain indices measured following cues to reduce rate. Average correlations are generated for each step of the forward regression (as shown along the x-axis).

