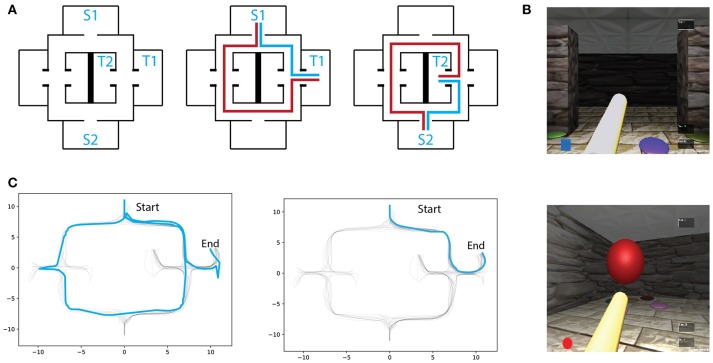
Figure 1.
(A) Left: Virtual maze layout. S1,S2 and T1,T2 denote the possible starting and target locations, respectively. Two exmaple of starting-target combinations with respectively optimal (blue) and erratic (red) trajectories schematics. (B) Screenshots of the environment through first-person perspective. (C) Example of an early (Left) and a late (Right) trial trajectories from one subject.

