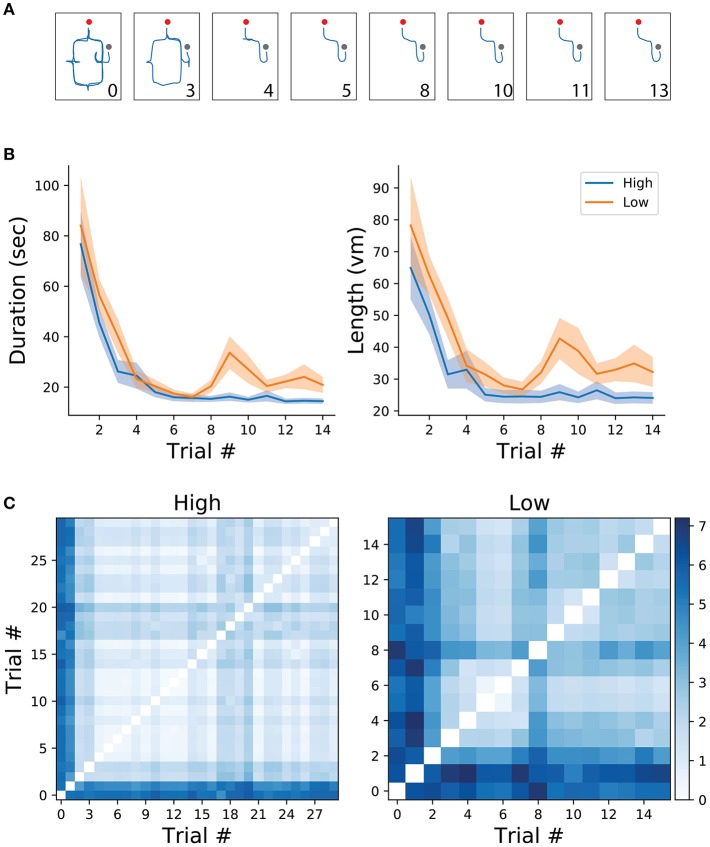
Figure 2.
(A) Example of trajectories from one participant in the high frequency condition. Numbers correspond to trial number. Red and gray dots represent the starting and end of the trial, respectively. (B) Mean and standard error of trial duration (left) and length (right) for the first 14 trials of each condition (high/low). (C) Route difference between every trajectory pair in each condition, averaged across subjects.

