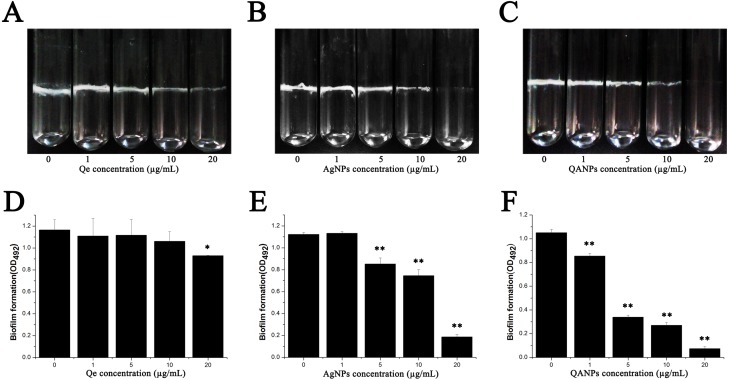
Figure 2. Effect of Qe, Ag NPs, and QA NPs on biofilm formation of E. coli strain ECDCM1.
(A–C) photographs of cells adhering to 15 mm ×150 mm glass tubes: (A) Qe; (B) Ag NPs; (C) QA NPs; (D–F) a crystal violet assay and the biofilm quantity being dissolved in 33% glacial acetic acid was measured by optical density at 492 nm: (D) Qe; (E) Ag NPs; (F) QA NPs. Error bars indicate standard deviations. The results represent a mean of three independent experiments. Double asterisks (**) represent means significantly different from the control group with no exposure to Qe, Ag NPs, or QA NPs (P < 0.01); an asterisk (*) represents means significantly different from the control group with no exposure to Qe, Ag NPs, or QA NPs (P < 0.05).

