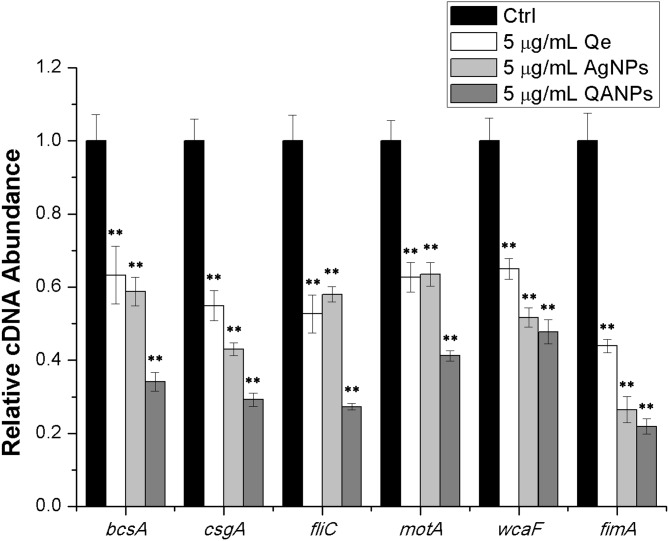
Figure 4. Comparative measurement of transcription (cDNA abundance) of the biofilm-associated genes in E. coli strain ECDCM1.
Relative transcript levels of bcsA, csgA, fliC, wcaF, motA, and fimA were determined by real-time RT-PCR in E. coli strain ECDCM1 cultured without or with Qe, Ag NPs, or QA NPs. Error bars indicate standard deviations. Double asterisks (**) represent means significantly different from control group with no antimicrobial agents (P < 0.01).

