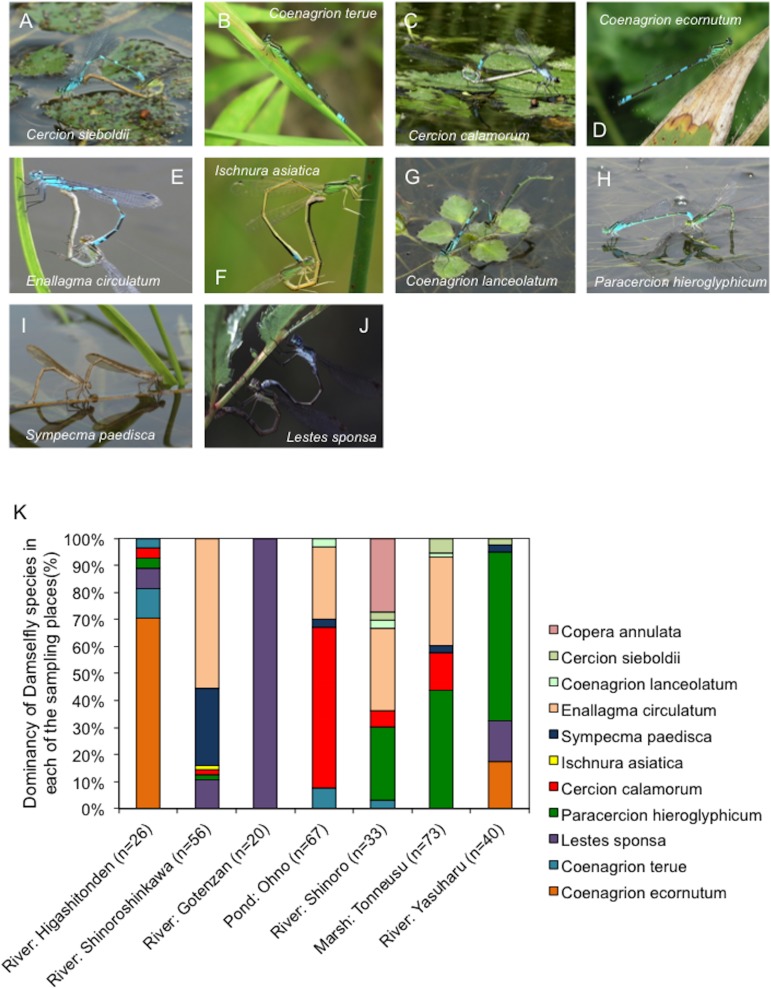
Figure 2. Representative images showing distinct morphological traits of damselflies and changes in the dominancy of different damselfly species at each sampling site.
(A–J) Representative images showing distinct morphological traits of damselflies. (K) The dominancy of different damselfly species differed between sampling sites, with a total of 11 species identified across all sites. The y-axis shows the dominancy of damselfly species as a ratio (%).

