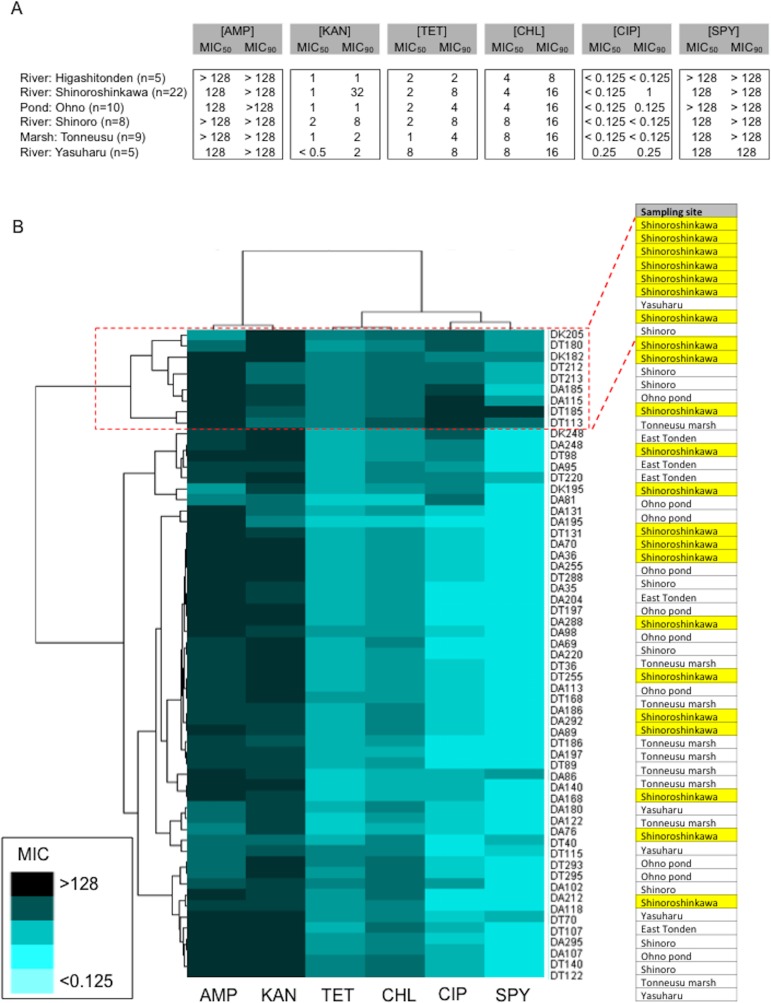
Figure 7. Comparison of the prevalence of antibiotic-resistant bacteria on SCD agar plates with that on MacConkey agar plates, and identification of representative antibiotic-resistant Enterobacterales, including MIC data.
(A) Antimicrobial susceptibility testing results for each of the isolates (MIC50 and MIC90) for six antimicrobial agents (AMP, KAN, TET, CHL, CIP, and SPY). Isolates were tested using the agar-dilution method on Muller-Hinton II agar medium (BD Biosciences) according to the criteria determined by the CLSI (Wiegand, Hilpert & Hancock, 2008). (B) Cluster analysis based on MIC data. The identified bacteria derived from the “River: Shinoroshinkawa” site formed a distinct cluster and had higher MIC values than isolates obtained from other locations. Yellow coloring indicates MIC values for isolates derived from “River: Shinoroshinkawa”.

