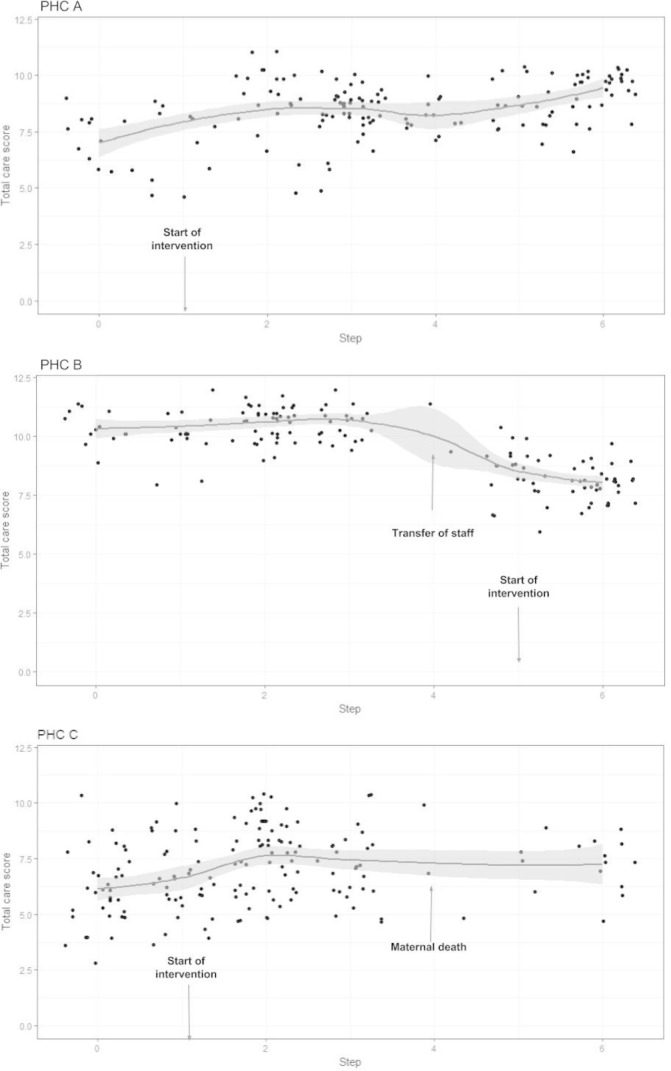
Figure 3.

Performance of three primary health centres (PHC). Y-axis represents the care score derived from adding the number of 12 childbirth practices received by a patient. Dots represent the care score of individual observed patient. Solid line with shaded area represents the smoothed trend in care score and its 95% CI.
