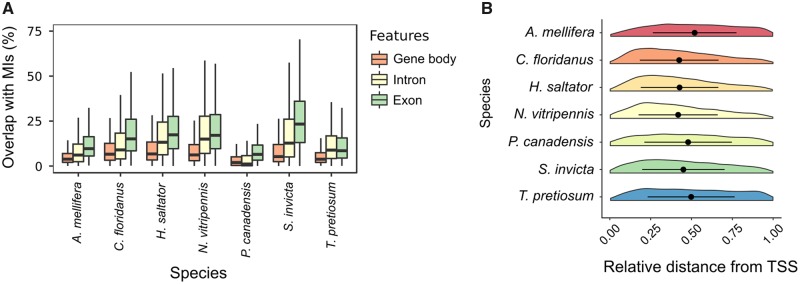
Fig. 2.
—Characterization of MIs across genic regions in seven hymenopteran species. (A) Box plots displaying the coverage of MIs across different types of genic regions (gene body, introns, and exons). (B) Violin plots comparing the relative position of MIs with regards to the TSS for genes with MIs.

