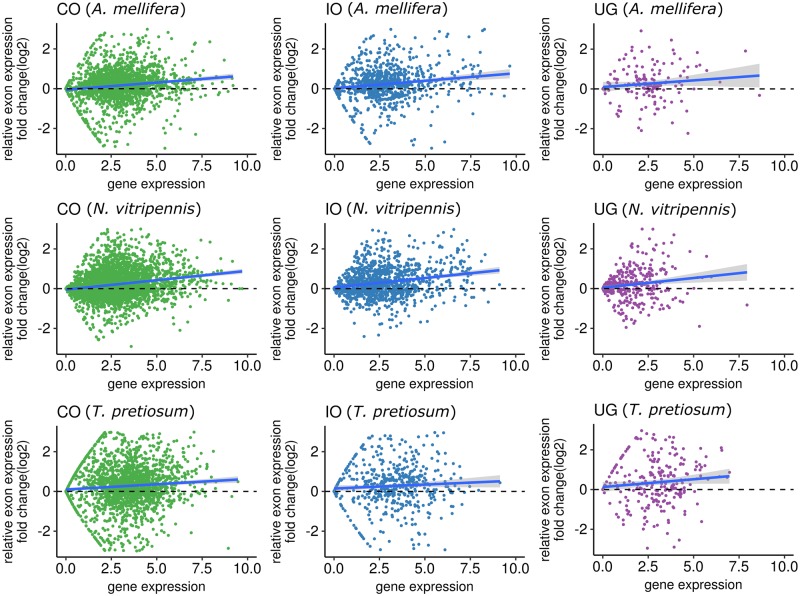
Fig. 6.
—Comparison of average expression levels between exons located in MIs (MI-exon) and exons located outside of MIs (non-MI-exon) within the same gene. For complete orthologous genes (CO), incomplete orthologous genes (IO), and unique genes in each species (UG), we calculated the expression fold change (log2 transformed) between MI-exons and non-MI-exons within the same gene, where each dot represents one gene. A locally weighted smoothing line is included to map the general direction bias of relative expression change; when the line is >0 it indicates higher expression in MI-exons compared with non-MI-exons and vice versa for when the line dips <0. We repeated this analysis for three species, (A) Apis mellifera, (I) Nasonia vitripennis, and (C) Trichogramma pretiousum.

