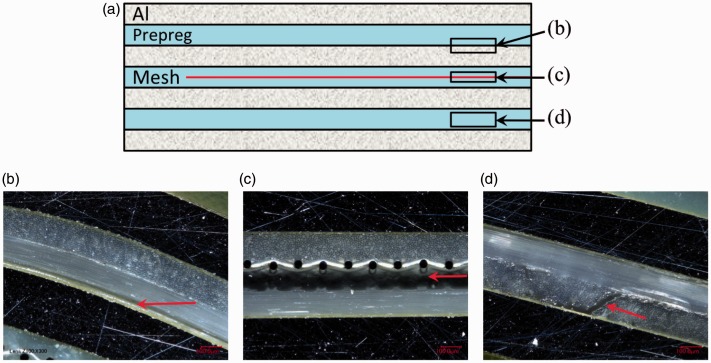
Figure 10.
Typical failure modes: (a) Schematic GLARE cross-section with failure mode locations (red arrows) and representative cross-sectional microscopy images of (b) intralaminar failure in prepreg layer close to aluminium layer, (c) failure at the mesh interface, (d) intralaminar failure in the outer prepreg layers. Scale: .

