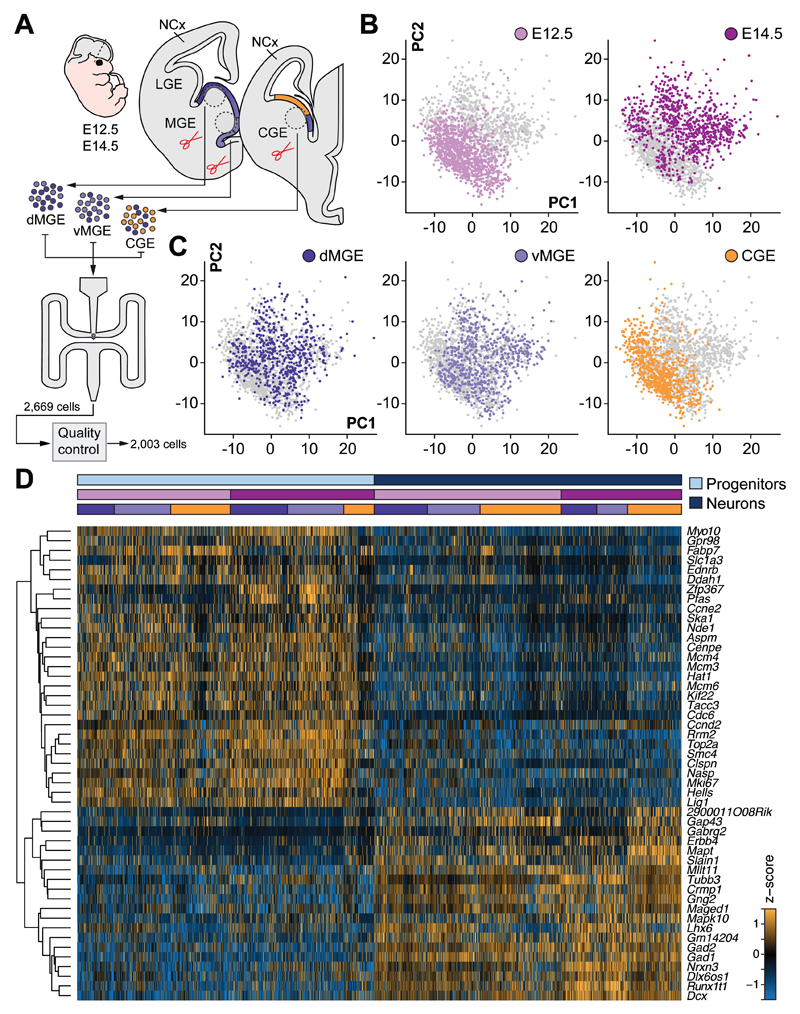
Fig. 1. Major sources of transcriptional heterogeneity among single cells from mouse MGE and CGE.
(A) Schematic illustrating sample collection, sequencing and single-cell RNA-seq analysis workflow. Single cells from E12.5 and E14.5 dMGE, vMGE and CGE were isolated and subjected to cDNA synthesis using a Fluidigm C1 system and RNA-seq. (B to C) Visualization of stage and region of origin variation in single cells using PCA. (D) RF classification of cells into progenitor or neuronal identity. The heatmap illustrates expression of genes selected by RF analysis that best represent progenitor or neuronal identity. Colored bars above the heatmap indicate cell identity, stage and region of origin.

