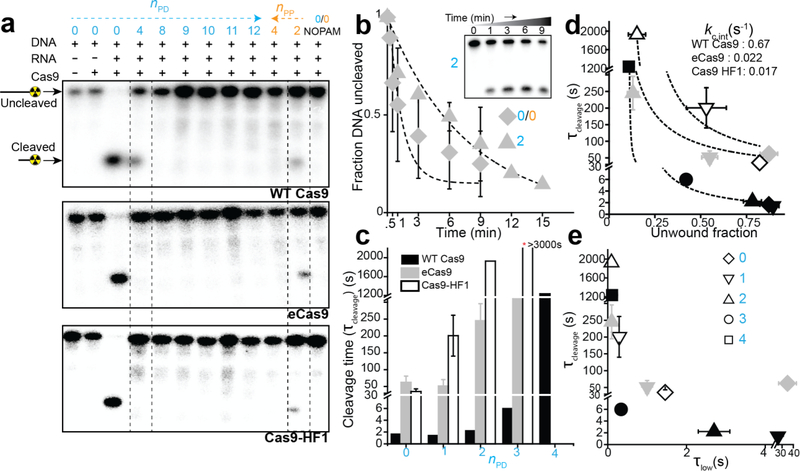
Figure 4. Cleavage vs mismatches and its relation with DNA unwinding.
(a) Cas9-RNA induced cleavage pattern analyzed by 15% denaturing polyacrylamide gel electrophoresis of target strand 5’-labeled with 32-P. Dashed boxes highlight DNA targets with nPD =4 and nPP =2 that show differences between EngCas9s and WT Cas9. (b) Fraction of uncleaved DNA vs time for eCas9 as a function of time and single exponential decay fits to obtain cleavage time τcleavage. Inset shows a representative gel image. [DNA] = 1 nM. [Cas9-RNA] = 100 nM. (c) τcleavage vs nPD. Data for WT Cas9-RNA is taken from a previous study33. (d) τcleavage vs unwound fraction as shown in Fig. 2c. Fits are made to determine kc,int (see methods). (e) τcleavage vs. unwound state lifetime as shown in Fig 2d. nPD and nPP are shown in cyan and orange, respectively. Error bars represent standard deviation (s.d.) from n=2 or 3. n=1 in the absence of error bar.

