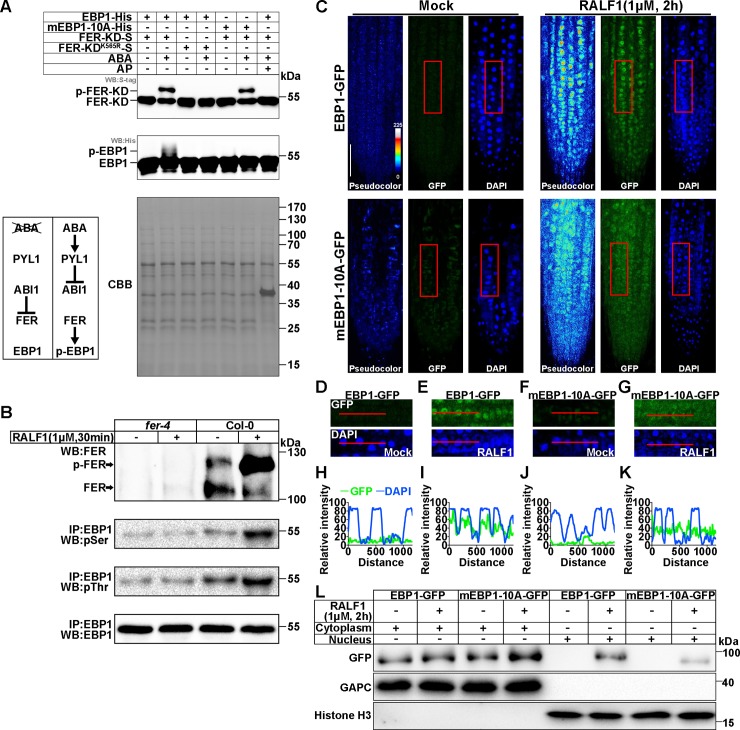
Fig 3. EBP1 nucleus accumulation and phosphorylation in response to RALF1-FER signaling pathway.
(A) In vitro phosphorylation assay of EBP1. The phosphorylated and dephosphorylated FER-KD-S and EBP1-His are indicated. Anti-S-tag was used to detect FER-KD-S. Anti-His was used to detect EBP1-His. CBB staining is displayed as loading control. The diagram shows the skeleton of an ABA-triggered phosphorylation system. (B) Phosphorylation assay of the IP EBP1. The phosphorylation level of FER is measured by the intensity of the phosphorylated and dephosphorylated FER bands detected with FER antibody. pSer and pThr antibodies were used to detect the phosphorylated EBP1. For RALF1 treatment, 4-week-old Col-0 and fer-4 plants were soaked in 1/2 MS liquid medium with or without 1 μM RALF1 for 30 minutes. EBP1 antibody was used to indicate loading control. We adjusted the level of total EBP1 protein to be same so that the changes in phosphorylation level of EBP1 can be easily visible. Three independent experiments of (A) and (B) were performed, and similar results were obtained. (C) Subcellular localizations of EBP1-GFP and mEBP1-10A-GFP in the root tip. Pseudocolor images show the signal intensities of the GFP signal. Color code bar indicates the relative intensities. The original pictures of GFP and DAPI signals are shown. Seedlings (with or without 1 μM RALF1 treatment for 2 hours) that were 7 DAG were used for observation. Bar = 50 μm. Five independent assays were performed, and similar results were obtained. (D-G) Close-ups of the GFP and DAPI signals in C (with red frames). (H-K) The selected areas (as indicated by the red lines in D-G) were analyzed for fluorescence intensity using ImageJ, and the yielded plot profiles are shown. All the fluorescence images were recorded using the same parameters under laser scanning confocal microscope. Three independent lines of EBP1-GFP and mEBP1-10A-GFP were analyzed, and similar results were obtained. (L) Abundance of EBP1-GFP and mEBP1-10A-GFP in the nucleus fraction. Immunoblot analyses of EBP1-GFP or mEBP1-10A-GFP in both the nuclear and nuclei-depleted soluble fractions from RALF1-treated (1 μM for 2 hours) or untreated plant. Antibody against GFP was used to detect EBP1-GFP or mEBP1-10A-GFP protein. Antibodies against GAPC or Histone H3 were used to mark cytosolic or nucleus fractions respectively. Similar results were obtained in three independent assays. Numerical data used to generate the plot in H-K are provided in S1 Data. ABA, abscisic acid; AP, alkaline phosphatase; CBB, Coomassie Brilliant Blue; DAG, day after germination; EBP1, ErbB3-binding protein 1; FER, FERONIA; FER-KD-S, FER kinase domain fused to S-tag; GAPC, cytosolic glycolytic GAPDHs; GFP, green fluorescent protein; IP, immunoprecipitated; MS, Murashige and Skoog; pSer, phosphoserine; pThr, phosphothreonine; RALF1, rapid alkalinization factor 1; WB, western blot.

