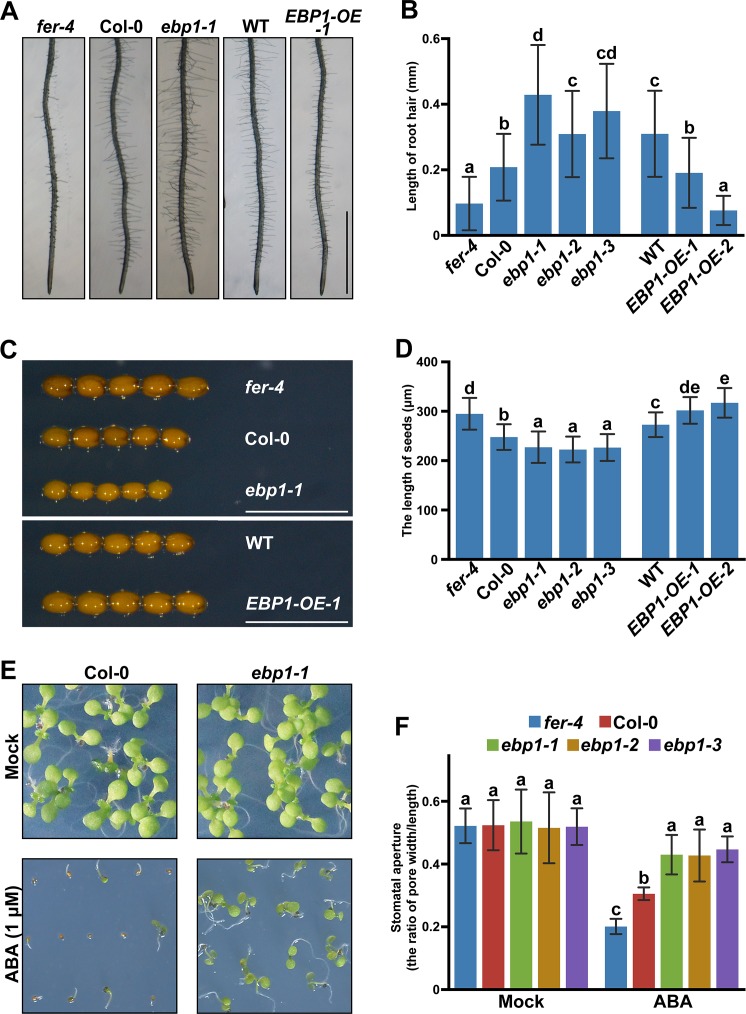
Fig 4. Comparison of ebp1 and fer4 mutant phenotypes in cell growth and ABA response.
Phenotype (A, bar = 1 mm) and statistical analysis (B) show that ebp1 plants have longer root hairs, whereas EBP1-OE plants show shorter root hairs as compared to the WT. At least 34 root hairs’ length of each plant line were measured. Phenotype (C, bar = 0.5 mm) and statistical analysis (D) show that ebp1 mutants plants have smaller seeds, whereas EBP1-OE plants show larger seeds as compared to the WT. For phenotypes of mutants and overexpressing lines, only one of each line (ebp1-1 and EBP1-OE-1) was chosen for displaying photos. Three lines of ebp1 and two lines of EBP1-OE were used in statistical analysis. At least 21 seeds were measured in each plant line. (E, F) ebp1 mutants are less sensitive to exogenous ABA as compared to WT. The images show 9-DAG plants grown on 1/2 MS agar medium supplemented with 0 μM ABA (Mock), or 1 μM ABA. (F) Stomatal aperture analysis in fer-4, Col-0, and ebp1 mutants before and after ABA treatment. The ratio of stomatal pore width/length was used to represent the aperture. The pore width and length were measured using ImageJ software. Ten guard cells of each plant lines were measured for statistical analysis. For phenotypes of mutants and overexpressing lines, only one of each line (ebp1-1 and EBP1-OE-1) was chosen for displaying. Data points are means +/− SD. Values with different letters are significantly different from each other, tested by one-way ANOVA. All assays were performed in three independent experiments, and similar results were obtained. Numerical data used to generate the plot in B, D, and F are provided in S1 Data. ABA, abscisic acid; DAG, day after germination; EBP1, ErbB3-binding protein 1; EBP1-OE, EBP1-overexpression; MS, Murashige and Skoog; WT, wild type.

