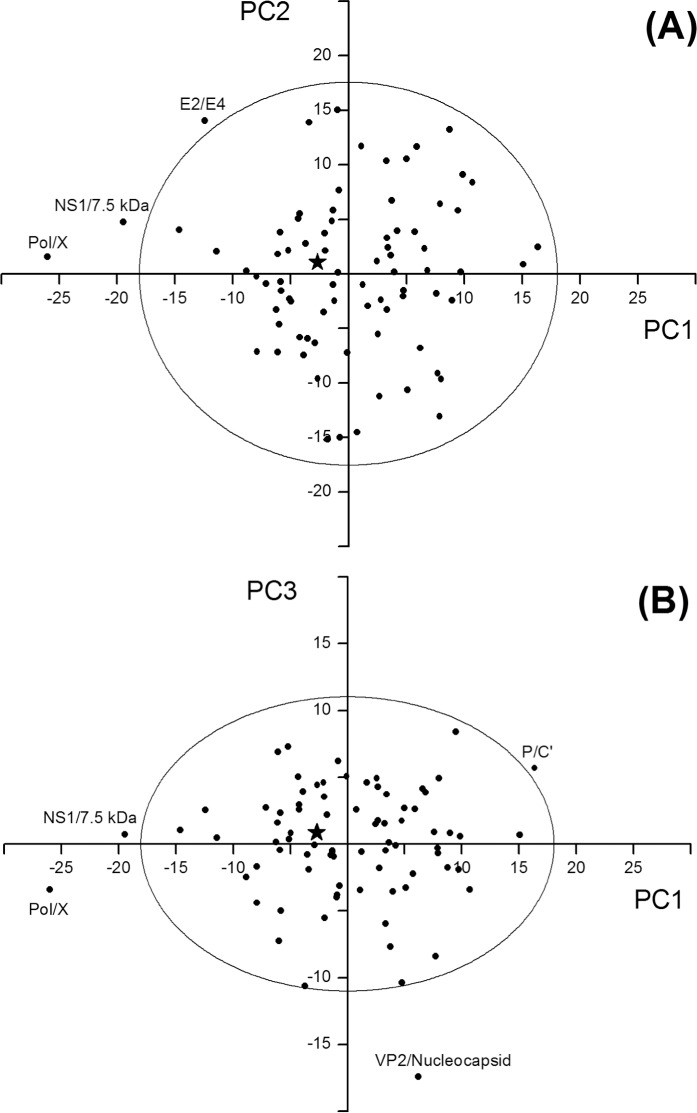
Fig 4. Principal component analysis (PCA) of overlapping genes.
The star symbol near the origin of the axes indicates the pooled dataset of overlapping genes, while the black circles indicate the individual overlapping genes. Circles outside the ellipse are outliers, that is overlaps with a composition significantly different from the rest (P<0.05). (A) Map yielded by the first (PC1) and second (PC2) principal component. (B) Map yielded by the first (PC1) and third (PC3) principal component.

