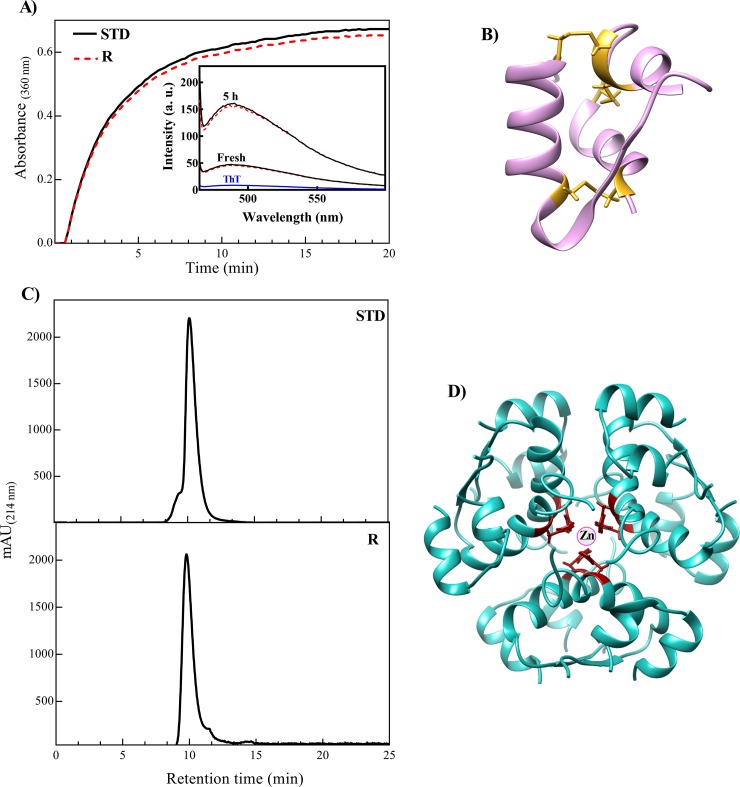
Fig 11. The aggregation and size exclusion analyses of the recombinant and standard insulin samples.
(A) The tendencies of two insulin samples (0.5 mg/mL) were analyzed in the presence of DTT at 40°C. The Inset displays ThT fluorescence emissions of two insulin samples which incubated for 5 h under fibrillogenic conditions. (B) Schematic representation of insulin monomer extracted from 3AIY pdb. The disulfide bonds indicated in yellow. (C) The size exclusion chromatography was performed in a condition favoring formation of the hexameric form. The STD and R stand for standard and the recombinant insulin samples, respectively. (D) The hexameric form of human insulin extracted from 3AIY pdb and red residues show HisB10.

