

Abstract
Objectives
Interindividual variability in glucuronidation of bilirubin and drugs by UDP-glucuronosyltransferase 1A1 (UGT1A1) is considerable and only partially explained by genetic polymorphisms and enzyme inducers. Here we determined whether a well-known epigenetic modification, cytosine methylation, explains a proportion of this variability in human liver.
Methods
UGT1A1 phenotypes, including UGT1A1 protein and bilirubin glucuronidation, and UGT1A1*28 genotype were determined using a human liver bank (n = 46). Methylation levels were quantified at 5 CpG sites associated with known transcription factor response elements in the UGT1A1 promoter and distal enhancer, as well as a CpG-rich island 1.5 kb further upstream.
Key findings
Individual CpG sites showed considerable methylation variability between livers, ranging from 10- to 29-fold variation with average methylation levels from 25 to 41%. Multivariate regression analysis identified *28/*28 genotype, −4 CpG site methylation and alcohol history as significant predictors of UGT1A1 protein content. Exclusion of livers with *28/*28 genotype or alcohol history revealed positive correlations of −4 CpG methylation with bilirubin glucuronidation (R = 0.73, P < 0.00001) and UGT1A1 protein content (R = 0.54, P = 0.008).
Conclusion
These results suggest that differential methylation of the −4 CpG site located within a known USF response element may explain a proportion of interindividual variability in hepatic glucuronidation by UGT1A1.
Keywords: bilirubin glucuronidation, DNA methylation, epigenetic regulation, human liver, UGT1A1
Introduction
Glucuronidation is a major pathway for the metabolism of many drugs, other xenobiotics and endogenous compounds in humans.[1,2] Interindividual variability in glucuronidation can be substantial and can lead to inappropriate drug levels and associated toxicity or inefficacy.[1,3–5] Environmental influences, physiological factors and genetic differences are thought to cause this large variation.[1,6–9]
Glucuronidation is catalysed by the UDP-glucuronosyltransferase (UGT) enzymes, which in humans include 18 functional enzymes categorized based on genetic similarity. The UGT1A gene complex located on chromosome 2q37 encodes half (9 of 18) of the functional UGT enzymes in humans through differential splicing of nine different exons 1 (each with their own promoter and enhancer) to shared exons 2 to 5. UGT1A1 is responsible for the biotransformation of various important drugs, including a widely used anticancer drug (irinotecan, specifically the active metabolite SN-38), an oral contraceptive agent (α-ethinylestradiol), an anti-HIV drug (raltegravir), various opioid drugs (including buprenorphine), and a variety of food-derived flavonoids as well as some mutagens, like heterocyclic amines.[2,10–15] UGT1A1 is the only enzyme that can catalyse bilirubin glucuronidation, therefore genetic variations of UGT1A1 have been associated with mild (Gilbert syndrome and Crigler–Najjar type 2 syndrome) and severe (Crigler–Najjar type 1) unconjugated hyperbilirubinemia with associated pathological consequences.[16]
About 150 genetic polymorphisms and mutations of UGT1A1 are listed at the UGT allele nomenclature website (http://www.ugtalleles.ulaval.ca). UGT1A1 genotyping has the potential to reduce morbidity and mortality in colorectal cancer patients treated with irinotecan.[17] In particular, UGT1A1*28, a common variant allele in the gene promoter that leads to a lower expression of the gene, was reported to be clinically important for the prediction of severe irinotecan toxicity.[18]
Apart from gene sequence differences, another important cause of variable gene expression occurs through epigenetic regulation of genes via DNA methylation and also by covalent modifications of histone proteins. Although epigenetic changes have been associated with certain diseases,[19] particularly cancer, published data are limited regarding the role of epigenetics in the regulation of drug metabolizing enzymes, including UGTs.
Several recent studies using cancer cell lines and promoter reporter constructs have demonstrated that UGT1A1 expression may be regulated by methylation of promoter CpG sites.[20,21] However, the functional importance of this epigenetic modification in normal human tissues still needs to be clarified.
The main aim of the present study was to determine for the first time the interindividual variability of DNA methylation at selected CpG sites in the UGT1A1 5'-flanking region using a bank of well-characterized human livers. We also evaluated whether methylation at one or more of these sites correlated with UGT1A1 phenotype (protein content and enzyme activity). Such a CpG site could potentially serve as a genomic biomarker of variable drug glucuronidation mediated by UGT1A1.
Materials and Methods
Human liver bank samples
Previously well-characterized human liver bank samples (see[1]) maintained in the Molecular Physiology and Pharmacology Department, Tufts University, School of Medicine were used in the present study. All of the liver samples were either intended to be used in transplantation or were normal tissue adjacent to surgical specimens. A total of 46 samples were included in the study. The demographic characteristics of the liver donors (age, gender, ethnicity, cause of death, smoking, alcohol and drug exposure history) have been reported in previous studies.[1–3,6,9,13,22–24] Briefly, 24% of the donors were female (n = 11) and 76% male (n = 35). Forty-one of the donors were whites, four of them were African-Americans and one was Hispanic. Smoking and alcohol history were positive in 18 (39.1%) and 12 (26.1%) donors, respectively. No smoking and alcohol information was available in 5 and 6 of the donors, respectively. Positive smoking history was defined as smoking of at least half a pack per day and positive alcohol history was consuming an average of more than two drinks per day. The average (± SD) age of the donors was 41.3 ± 18.8 years, with a range of 5 to 74 years. All of the subjects provided written informed consent for the experimental use of the samples. Tufts University Institutional Review Board approved the use of these samples in the experimental studies.
Bilirubin glucuronidation by human liver microsomes
Bilirubin glucuronidation was used as an assay for isoform-selective quantitation of UGT1A1 enzymatic activity. Briefly, bilirubin was freshly dissolved each day in pure dimethyl sulfoxide at a concentration of 0.5 mm and then diluted with incubation buffer (50 mm phosphate buffer, pH 7.5) to a final concentration of 10 μm. Incubations (100 μl final volume) included microsomes (10 μg protein), alamethicin (50 ng), UDP-glucuronic acid (5 mm final concentration) and magnesium chloride (5 mm final concentration). All incubations were conducted in brown Eppendorf tubes (and protected from ambient light in downstream procedures) to minimize bilirubin degradation. The reaction was stopped after 10 min of incubation at 37°C by the addition of acetonitrile (50 μl) containing 5% acetic acid and 3'-azido-3'-deoxy-thymidine (AZT; 0.25 nmoles) as the internal standard. After centrifugation for 10 min at 13,000g, the supernatant was analysed by HPLC (1100 system, Agilent) with UV absorbance detection at 450 nm (bilirubin and bilirubin glucuronide) and 254 nm (AZT). A Synergi Hydro-RP C18 (4.6 mm × 25 cm × 10 μm) column (Phenomenex) was used. Mobile phases consisted of 0.1% trifluoroacetic acid in water (A) and 0.1% trifluoroacetic acid in acetonitrile (B) at a combined flow rate of 1.0 ml/min. For each run, mobile phase B was linearly increased from 10% at the start to 100% at 20 min, held for a further 10 min and returned to 10% at 32 min with a 34 min total run time. Product formation was confirmed to be linear for up to 60 min incubation and up to 0.5 mg/mL microsomal protein concentration. Peak elution times were 8 min, 15 min and 29 min for AZT (IS), bilirubin glucuronide and bilirubin, respectively. A second smaller glucuronide peak eluting at 12 min in some samples (not quantitated) was confirmed by HPLC-MS to be the bilirubin diglucuronide. In addition to HPLC-MS, bilirubin peak identity was confirmed by observing the effects of exclusion of cofactor, substrate and microsomes. Since bilirubin glucuronide was not available, quantitation was performed using a standard curve of different concentrations of bilirubin, assuming a similar UV absorbance extinction coefficient. The limit of quantitation of bilirubin glucuronide formation was 5 pmoles/min/mg protein, and there was less than 15% variation between duplicates within each assay, and less than 20% variation between assays for positive control samples.
UGT1A1 protein levels and genotyping of UGT1A1*28 polymorphism
Immunoquantified liver microsome UGT1A1 protein levels and liver donor UGT1A1*28 genotype were used from a previously published study.[2]
DNA methylation quantitation at individual CpG sites
DNA methylation was quantified at five different CpG sites in the UGT1A1 5'-flanking region by sequencing of bisulfite-converted DNA. CpG sites were numbered according to their appearance upstream from the UGT1A1 ATG start codon, with −1 CpG representing the first site, −2 CpG representing the second site and so on. CpG sites were selected for assay since they were within or adjacent to functionally validated transcription factor response elements, including PBX (-3 CpG), USF (-4 CpG), AhR (-28 CpG), Nrf2 (-29 CpG) and PXR (-30 CpG).[20,25]
Briefly, genomic DNA was prepared from the liver samples using DNAzol reagent (Invitrogen, MA). Samples were sodium-bisulfite modified with the Epitect® Bisulfite Kit (Qiagen, MA) according to the manufacturer's instructions. Five hundred nanograms of genomic DNA were used for each bisulfite modification. The bisulfite-treated DNA samples were stored at −20°C until further use. Primers given in Table 1 were used for amplification of the bisulfite-modified DNA using a nested PCR approach to enhance sensitivity. Two different fragments were amplified, including one for the analysis of −3 and −4 CpG sites and the other for the −28, −29 and −30 CpG sites. For both sites, after the first round of PCR, the products were 100x diluted in TE buffer and 1 μl used as template DNA for the second round of PCR. A touchdown PCR protocol was used with an initial denaturation step at 95°C for 10 min, followed by 40 cycles of denature (93°C for 30 s), anneal (65–45°C for 30 s, decreasing each cycle by 1°C for 20 cycles and then 45°C for 20 cycles) and extend (72°C for 1 min), followed by a final extension at 72°C for 10 min. The amplified fragments were treated with ExoSAP-IT and sequenced using the forward and reverse second-round PCR primers given in Table 1. The percentage of methylation was calculated from the sequence chromatograms as previously described by Leakey et al.[26] Details of the method are given in Figure 1. Reproducibility of the assay was evaluated by testing duplicate samples with either high or low methylation values on different days. The results showed less than 10% variation in values between assay days.
Table 1.
Primer pairs used for nested PCR amplification and sequencing of bisulfite-modified DNA to quantitate cytosine methylation at the −3, −4, −28, −29 and −30 CpG sites in the UGT1A1 promoter and 5′-enhancer regions. The products of first-round PCR were used as a template for the second-round PCR reaction to enhance assay sensitivity
| CpG sites | Forward and reverse PCR primer pairs | Region amplified (relative to start codon) | |
|---|---|---|---|
| PCR | Sequences (5′ to 3′) | ||
| −3, −4 | First | TGG ATT TTG AGG TTT TGG AAG T | −277 to +85 |
| CTT CCC AAC ATA AAA CAC CAC TAA | |||
| Second | GAG GTT TTG GAA GTA TTT TGT TGT G | −269 to +20 | |
| CCC TAA AAC TCC ACA ACC ATA A | |||
| −28, −29, −30 | First | GGG ATA AAT ATG GGA TGT AGT GAT | −3650 to −3198 |
| CCT CTT ACC CTC TAA CCA TTC TAA | |||
| Second | TGG GGG GAT TTT TTT TGA GAT TTG AG | −3588 to −3225 | |
| CCT TAC TAT TCC CCA AAC TTC CTT TAA T | |||
Figure 1.
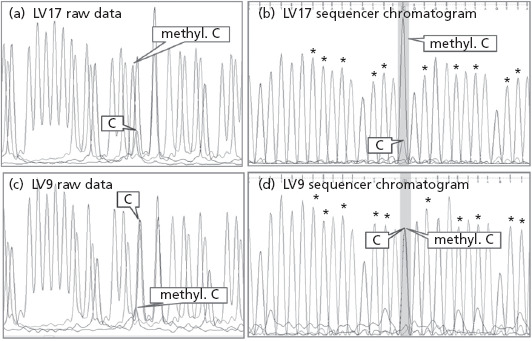
Examples of sequence chromatograms of PCR-amplified bisulfite-converted DNA samples used to quantitate methylation at the −4 CpG site located in the UGT1A1 promoter. The bisulfite reaction deaminates all unmethylated cytosines (C) to uracils, which are then replaced by thymines during subsequent PCR amplification. All methylated cytosines (methyl. C) remain unchanged after bisulfite treatment. Traces from a liver sample with (a, b) an estimated 76% methylation (LV17) and (c, d) 8% methylation (LV9). (a) and (c) The raw data chromatograms prior to sequencer software processing that adjusts average peak height and elution time adjustments to enable automated sequence calls. The results of this processing are shown in (b) and (d), respectively. Note the large increase in apparent height of the small methyl. C peak in (c) to that in (d) resulting from this processing. The relative amount of cytosine methylation was calculated from the processed chromatograms according to the method of Leakey et al.[26] by expressing the height of the unmethylated cytosine (C) peak (converted to thymine) as a percentage of the average height of 10 surrounding non-CpG thymidine peaks (indicated in (b) and (d) by asterisks) and subtracting this value from 100.
DNA methylation quantitation of a UGT1A1 5'-flanking CpG-rich island
A CpG-rich island located between 4.5 and 5.5 kb upstream of the UGT1A1 translation start site (about 1–2 kb upstream of validated enhancer elements at −3.5 to −3.3 kb) was assayed for methylation status using commercially available reagents (EpiTect® Methyl DNA Restriction Kit and EpiTect® Methyl qPCR Primer Assay, Qiagen). Liver samples analysed included nine livers with relatively high bilirubin glucuronidation activity and UGT1A1 protein content (LV 25, 27, 30, 37, 39, 41, 43, 50 and 51) and nine livers with relatively low bilirubin glucuronidation activity and UGT1A1 protein content (LV 2, 3, 15, 22, 23, 26, 52, 53 and 55). A spreadsheet utility provided by the manufacturer was used to calculate the percentage methylation (averaged across the 42 CpG sites assayed within the CpG-rich island) using the derived real-time PCR data.
Statistical analysis
Statistical analyses of data were performed using Sigmaplot version 11.0 (Systat, San Jose, CA). Effects of age, sex, ethnicity, smoking, alcohol and UGT1A1*28 genotype (recessive model) on methylation status were tested by Student's t-test (if normality and equal variance analysis tests passed) or by Mann–Whitney U-test. Relationships between the methylation status of different CpG sites and between the individual CpG sites and UGT1A1 protein content and enzyme activity (bilirubin glucuronidation) were evaluated using Spearman rank order correlation analysis. A P value of less than 0.05 was accepted as statistically significant. Multivariate analysis to account for the effects of demographic variable and different CpG sites on the examined phenotypes (UGT1A1 protein content and bilirubin glucuronidation activity) was also performed using a forward stepwise multiple linear regression approach. UGT1A1 protein content and glucuronidation activities were log transformed prior to analysis. Since this was an exploratory analysis, a P value of less than 0.1 was considered sufficient for entry into the final multivariate model.
Results
UGT1A1 phenotype and genotype characterization of the liver bank samples
Among the 46 liver samples assayed, mean ± SD UGT1A1 protein content was 17 ± 10 arbitrary units (relative to the lowest value) with a percentage coefficient of variation (CV%) of 58%, while mean ± SD bilirubin glucuronidation activity was 0.69 ± 0.48 nmole equivalents/min/mg protein with a CV% of 70%. An excellent correlation was observed between UGT1A1 protein content and bilirubin glucuronidation activities (Spearman Rho [Rs] = 0.87, P < 0.0001).
With regard to the UGT1A1*28 polymorphism, liver donor genotype frequencies were 52.2% (n = 24), 34.8% (n = 16) and 13.0% (n = 6) for UGT1A1 *1/*1, *1/*28 and *28/*28 genotypes, respectively, with an overall UGT1A1*28 allele frequency of 0.30. Observed genotype numbers were consistent with the expected Hardy–Weinberg equilibrium frequencies (X2 = 1.47, P = 0.23).
Relative UGT1A1 protein levels were significantly lower in the *28/*28 genotype group vs the *1/*1 or *1/*28 genotype groups with mean ± SD levels of 9 ± 10 and 18 ± 10, respectively (P = 0.002, Student's t-test). A similar, although somewhat weaker, genotype effect (P = 0.03, Student's t-test) was also observed for bilirubin glucuronidation with mean ± SD activities of 0.53 ± 0.72 and 0.72 ± 0.44 nmoles/min/mg protein for the same genotype groups.
Interindividual variability in UGT1A1 5'-flanking region CpG methylation
Cytosine methylation was quantified in the 5'-enhancer region of UGT1A1 at five selected CpG sites within or adjacent to known transcription factor binding sites, as well as an adjacent CpG-rich island about 1–2 kb further upstream (see Figure 2a for exact locations relative to translation start site). As shown in Figure 2b, the CpG-rich island was essentially hypermethylated in all but one liver analysed, with mean ± SD (CV%) values of 96 ± 3% (3%), excluding LV41. LV41 showed somewhat lower methylation (70%) and this value was confirmed by repeated assays. In contrast to the CpG-rich island, there was considerable variability in methylation of the other 5'-enhancer CpG sites with mean ± SD (CV%) values of 37 ± 13% (35%), 37 ± 14% (38%), 41 ± 15% (37%), 37 ± 14% (38%) and 25 ± 18% (72%) for −3, −4, −28, −29 and −30 CpG sites, respectively.
Figure 2.
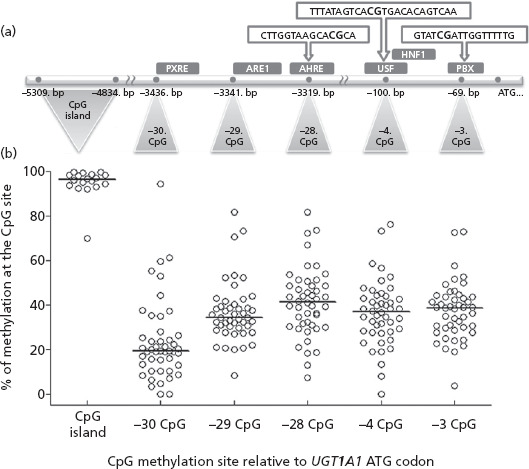
(a) 5'-flanking region of UGT1A1 exon 1, including promoter and distal enhancer. The CpG sites were numbered according to their appearance upstream from the ATG start codon. Corresponding base pairs indicate the distance from the ATG codon. The positions of response elements for different transcriptional factors (PXR, Nrf-2, AhR, USF, HNF-1α and PBX) are marked as experimentally demonstrated previously.[20,25] (b) Percentage methylation values derived for individual livers at the five different CpG sites and the CpG-rich island. The horizontal lines represent the median of the percentage methylation values derived for the individual CpG sites in 46 normal human liver samples and the CpG-rich island using 18 normal human liver samples with either high (n = 9) or low (n = 9) bilirubin glucuronidation and UGT1A1 protein content.
Correlation of methylation levels between CpG sites
Spearman correlation coefficients and significance values for the correlation of methylation levels between the five specific CpG sites analysed are given in Table 2. As shown in Figure 3, relatively strong correlations were observed between adjacent CpG sites, especially the −3 and −4 CpG sites (Rs = 0.83, P < 0.000001) and the −28 and −29 CpG sites (Rs = 0.82, P < 0.000001). Weaker correlations were observed between the −30 CpG site and the other upstream sites, while there were only minimal correlations between the proximal and distal enhancer region CpG sites.
Table 2.
Correlation of cytosine methylation between five different CpG sites (−3, −4, −28, −29 and −30 sites relative to the start translation) located in the UGT1A1 promoter and 5'-enhancer measured using DNA extracted from a bank of 46 human livers. Shown are the Spearman correlation coefficients (and P values) for the indicated comparisons
| CpG site | −4 CpG | −28 CpG | −29 CpG | −30 CpG |
|---|---|---|---|---|
| –3 CpG | 0.83 (<0.000001) | 0.25 (0.09) | 0.19 (0.21) | −0.09 (0.54) |
| –4 CpG | 0.22 (0.14) | 0.18 (0.23) | 0.15 (0.33) | |
| –28 CpG | 0.82 (<0.000001) | 0.46 (0.002) | ||
| –29 CpG | 0.52 (<0.001) |
Figure 3.
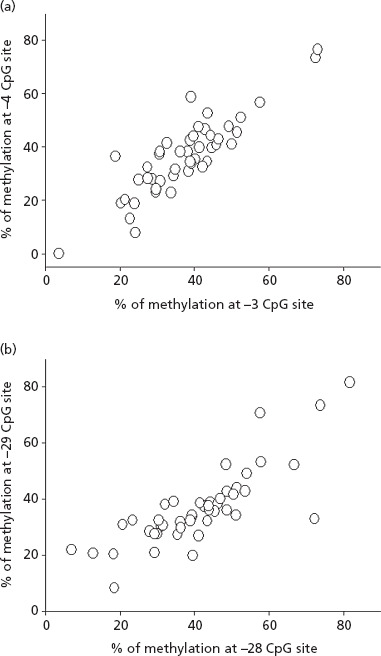
Correlation in methylation values determined for individual livers (n = 46) measured at (a) the −3 and −4 CpG sites and (b) the −28 and −29 CpG sites.
Association of CpG methylation with liver donor demographics and genotype
Generally, no significant associations were observed between liver donor demographics (including gender, race/ethnicity, smoking and alcohol) and CpG site methylation (Table 3). The only exception was UGT1A1*28 genotype, which showed about 50% higher −28 CpG site methylation in livers with the UGT1A1 *1/*1 or *1/*28 genotypes as compared with livers with the *28/*28 genotype (P = 0.04; Student's t-test).
Table 3.
Effect of different liver donor demographic characteristics on methylation quantitated at five different CpG sites in the UGT1A1 5'-enhancer in 46 human liver bank samples
| Demographic characteristics | n | Median (interquartile range) percent methylation at CpG site | |||||
|---|---|---|---|---|---|---|---|
| –3 CpG | –4 CpG | –28 CpG | –29 CpG | –30 CpG | |||
| Gender | Female | 11 | 33 (27–41) | 38 (29–46) | 36 (29–42) | 36 (31–38) | 24 (20–34) |
| Male | 35 | 39 (30–44) | 35 (28–44) | 44 (33–51) | 34 (28–42) | 19 (11–24) | |
| P value | 0.56 | 0.94 | 0.18 | 1.0 | 0.12 | ||
| Race | Caucasian | 42 | 39 (31–44) | 38 (29–44) | 43 (32–51) | 35 (30–42) | 20 (13–28) |
| African-American | 4 | 25 (22–43) | 24 (17–42) | 25 (20–36) | 29 (24–34) | 14 (8–22) | |
| P value | 0.41 | 0.33 | 0.07 | 0.14 | 0.34 | ||
| Smoking | No | 23 | 34 (30–43) | 35 (27–41) | 41 (31–49) | 33 (30–37) | 21 (14–25) |
| Yes | 18 | 39 (25–46) | 37 (28–43) | 42 (30–51) | 38 (31–42) | 19 (8–20) | |
| P value | 0.65 | 0.59 | 0.75 | 0.35 | 0.28 | ||
| Alcohol | No | 28 | 37 (28–45) | 37 (28–42) | 40 (23–48) | 33 (29–38) | 19 (12–24) |
| Yes | 12 | 36 (30–45) | 36 (26–44) | 43 (35–50) | 40 (32–48) | 20 (15–41) | |
| P value | 0.72 | 0.74 | 0.45 | 0.08 | 0.29 | ||
| UGT1A1 | *1/*1 or *1/*28 | 40 | 39 (29–44) | 36 (28–44) | 43 (33–50) | 36 (31–41) | 20 (13–26) |
| *28/*28 | 6 | 37 (30–43) | 38 (28–41) | 29 (13–39) | 25 (21–34) | 15 (13–28) | |
| P value | 0.82 | 0.90 | 0.04* | 0.09 | 0.50 | ||
*P < 0.05 for comparisons either by Student's t-test (all −3, −4, −28 CpG values) if normality and equal variance passed, or by Mann–Whitney U-test (all −29 and −30 CpG values).
Association of CpG methylation with UGT1A1 phenotypes
Initially, univariate analysis (Spearman correlation) was used to examine possible associations of the degree of methylation at each of the CpG sites with each of the UGT1A1 phenotypes (UGT1A1 protein content and bilirubin glucuronidation activity) for the entire liver bank (n = 46), as shown in Table 4. There was a weak positive correlation of bilirubin glucuronidation with −4 CpG site methylation (Rs = 0.30, P = 0.04) and with −29 CpG site methylation (Rs = 0.33, P = 0.03), whereas UGT1A1 protein content was only weakly positively correlated with −29 CpG methylation (Rs = 0.35, P = 0.02).
Table 4.
Spearman correlation analysis of UGT1A1 phenotypes (bilirubin glucuronidation activity and UGT1A1 immunoquantified protein levels) with cytosine methylation quantitated at five different CpG sites in the promoter and 5'-enhancer region of UGT1A1. Analyses were conducted in all samples (n = 46), and a subgroup that excluded donors with a positive alcohol history or UGT1A1*28/*28 genotype (n = 23). Shown are Spearman Rho (Rs) correlation coefficients and the corresponding P values
| UGT1A1 phenotype | CpG site | All samples | Alcohol (–) and UGT1A1 *1/*1 or *1/*28 | ||
|---|---|---|---|---|---|
| Rs | P value | Rs | P value | ||
| Bilirubin glucuronidation | –3 CpG | 0.27 | 0.08 | 0.61 | 0.002* |
| –4 CpG | 0.30 | 0.04* | 0.73 | <0.00001* | |
| –28 CpG | 0.24 | 0.11 | 0.065 | 0.76 | |
| –29 CpG | 0.33 | 0.03* | 0.012 | 0.95 | |
| –30 CpG | 0.13 | 0.38 | 0.15 | 0.50 | |
| UGT1A1 protein | –3 CpG | 0.18 | 0.24 | 0.37 | 0.08 |
| –4 CpG | 0.22 | 0.15 | 0.54 | 0.008* | |
| –28 CpG | 0.25 | 0.09 | 0.01 | 0.96 | |
| –29 CpG | 0.35 | 0.02* | −0.06 | 0.78 | |
| –30 CpG | 0.07 | 0.63 | −0.016 | 0.94 | |
P < 0.05.
Forward stepwise multiple linear regression analysis (general linear model) was used to identify additional factors (gender, race/ethnicity, smoking, alcohol or UGT1A1 *28/*28 genotype) that might modify the relationship of CpG methylation with UGT1A1 phenotype. With regard to UGT1A1 protein content, three factors entered the model (in order): *28/*28 genotype (associated with lower content, P = 0.016), −4 CpG methylation (associated with higher content, P = 0.026) and alcohol history (associated with higher content, P = 0.079). These factors accounted for 12%, 11% and 9% (respectively) of the observed variability (R2 = 0.32, P = 0.003). With regard to bilirubin glucuronidation activity, only two factors entered the model (in order): −4CpG methylation (associated with higher activity, P = 0.018) and alcohol history (associated with higher activity, P = 0.023). These factors accounted for 13% and 12%, respectively, of the observed variability (R2 = 0.25, P = 0.005).
Given the apparent modifying effects of UGT1A1*28 genotype and alcohol history on the relationship between CpG methylation and UGT1A1 phenotype, univariate correlations were then performed on a subgroup of the liver bank samples that excluded those donors with a significant alcohol history or with the *28/*28 genotype (Table 4). This analysis showed significant positive correlations between −4 CpG methylation and bilirubin glucuronidation (Rs = 0.73, P < 0.00001) (Figure 4a), and also between −4 CpG methylation and UGT1A1 protein content (Rs = 0.54, P = 0.008) (Figure 4b). A somewhat weaker correlation was also observed between −3 CpG site methylation and UGT1A1 protein content (Rs = 0.61, P = 0.002), but not between −3 CpG site methylation and bilirubin glucuronidation (Rs = 0.37, P = 0.08). In the same subgroup there were no correlations (Rs < 0.2 and P > 0.05) between methylation at the −28, −29 or −30 CpG sites and either UGT1A1 protein content or bilirubin glucuronidation (Table 4).
Figure 4.
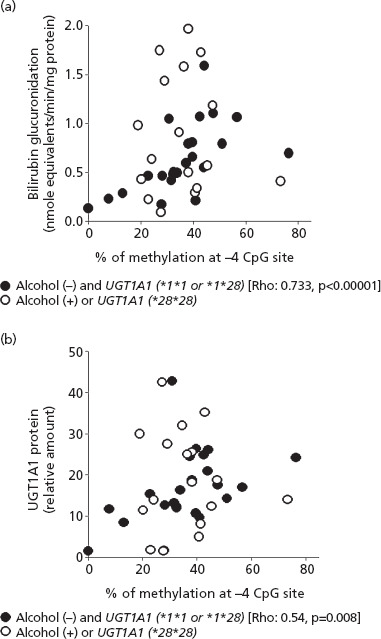
Correlation of (a) −4 CpG site methylation with (a) bilirubin glucuronidation and (b) UGT1A1 protein level measured in a bank of human livers (n = 46). The filled circles identify a subgroup that excludes donors with either a significant alcohol history or have the UGT1A1 *28/*28 genotype. Spearman correlation values (Rho coefficients and P values) are shown for this subgroup.
Discussion
In this study we evaluated interindividual variability in cytosine methylation in the 5'-flanking region of a major phase two-drug metabolizing enzyme in normal human liver tissues, and determined whether this variability was associated with enzyme phenotype (i.e. protein content and activity). The results clearly demonstrated high interindividual variability in the degree of methylation at CpG sites within or adjacent to known regulatory factor response elements. Furthermore, a relatively strong positive correlation was observed in certain CpG sites, particularly the −4 CpG site located within a known transcription factor response element (USF), after accounting for theee effects of the well-known UGT1A1 genetic polymorphism (*28) and a putative enzyme-inducing agent (alcohol).[1]
DNA methylation is a well-known gene regulatory mechanism that is most typically associated with transcriptional silencing of genes. In previous work using different colon cancer cell lines, it was shown that cells expressing relatively high amounts of UGT1A1 mRNA tended to have lower UGT1A1 5'-flanking region methylation as compared with lines expressing relatively low amounts of UGT1A1 mRNA, particularly at the −2 to −5 CpG sites near the gene promoter.[21] Consequently, we had hypothesized that the extent of methylation at these same CpG sites should be negatively correlated with UGT1A1 phenotype (i.e. more methylation should lead to less UGT1A1 protein and activity) in our human liver bank samples. Although none of the sites examined were negatively correlated, the −4 CpG methylation site was clearly positively correlated with UGT1A1 phenotype (i.e. more methylation was associated with lower UGT1A1 protein and activity). This −4 CpG site was previously shown to be within an upstream stimulating factor (USF) response element that is adjacent to a response element for a primary regulator of UGT1A1 expression, hepatocyte nuclear factor 1 (HNF-1).[20] In that study gel shift assays showed reduced binding of USF (from colon cancer cell nuclear extracts and synthetic USF-1) by −4 CpG methylation without affecting binding of HNF-1α. Furthermore, mutation of the USF site in UGT1A1 promoter–reporter constructs resulted in decreased reporter activity.
In the present study it is not clear why the −4 CpG site methylation was associated with increased (rather than decreased) UGT1A1 expression in the liver bank samples. However, it should be noted that the prior studies were performed using colon cancer cell lines under basal (uninduced) conditions, and so regulation of the −4 CpG-containing USF site might be different in normal human liver, which probably contains different transcription factors and is also exposed to external influences such as enzyme inducers. In this context, USF-1 was shown to be a repressor (rather than an enhancer) of induction of CYP1A1 by an arylhydrocarbon receptor agonist, 3-methylcholanthrene, in HepG2 cells, a commonly studied human liver cell line.[27] Although beyond the scope of the current work, a future study could explore this hypothesis using human liver cell lines and primary hepatocytes. It should also be noted that bisulfite sequencing does not differentiate between 5-methylcytosine and other modified cytosines, including 5-hydroxymethylcytosine, the latter being a 5-methylcytosine metabolite found in high levels in brain, liver, kidney and colorectal tissues with potentially different affinities for DNA binding proteins.[28]
Although somewhat unusual, positive correlations between CpG methylation and gene expression have been reported previously. For example, Kelavkar et al. showed that increased methylation in the promoter of the gene encoding the 15-lipoxygenase type 1 enzyme leads to upregulation of gene expression and increased enzyme activity in prostate cancer patients.[29]
The degree of methylation at the −28 CpG site located in an AhR response element in the distal enhancer was significantly lower in livers with the UGT1A1*28*28 genotype compared to livers with *1*1 or *1*28 genotypes. Interestingly, bilirubin, an endogenous heme metabolite that is eliminated primarily by UGT1A1 glucuronidation, was recently demonstrated to regulate UGT1A1 gene expression through this same AhR response element.[30] Consequently, we speculate that decreased UGT1A1 activity and increased bilirubin levels caused by the UGT1A1*28 promoter variant may be partially compensated for by increased bilirubin-mediated AhR activation, which is reflected by decreased levels of methylation at the −28 CpG site.
We used two commonly used methods for quantifying CpG methylation in the human liver DNA samples. For measurement of individual CpG sites at known UGT1A1 enhancer sites we quantified directly from PCR product sequence chromatogram data derived by amplification of bisulfite-converted DNA samples, as described by deLeakey et al.[26] A similar method was used in the prior study of UGT1A1 promoter methylation in colon cancer cells.[20,21] In addition we assayed a CpG-rich region located between −4834 and −5309 base pairs upstream of the UGT1A1 start translation site using commercially available reagents specifically designed for this purpose. This method entails real-time PCR amplification of genomic DNA digested by methylation-sensitive and/or methylation-insensitive restriction enzymes that are specific for a subset of CpG sites.[31] The resultant PCR product contains multiple CpG sites (42 in this study) and so the calculated percentage of methylation is an average value for the entire CpG-rich island. Our results showed that the UGT1A1 5'-flanking region CpG-rich island is essentially hypermethylated in all livers, indicating that this region may not be important for variable UGT1A1 expression.
Another finding of note was a strong positive correlation of methylation values between adjacent CpG sites, which confounded somewhat the associations between particular CpG sites and the UGT1A1 phenotypes. This is consistent with recent work showing significant correlations of CpG methylation within loci while correlations across loci tend to be much weaker.[32] However, those studies were conducted using DNA samples from tissues typically collected for epidemiological studies (blood and buccal swabs), while this study extends those observations to normal human liver. Since a long-term aim of the current study is to identify specific CpG sites (such as the UGT1A1 −4 CpG and perhaps the tightly linked −3 CpG) for use as predictive biomarkers of drug metabolism, future studies are needed to determine whether DNA methylation is correlated between liver and blood (or buccal) samples collected from the same individual.
A potential weakness of the current study is that we assayed only five of the 30 CpG sites in the UGT1A1 gene promoter/enhancer. These were specifically chosen because of their proximity to known UGT1A1 transcription regulatory sites and also results from prior studies of cancer cell lines. However, it is conceivable that methylation at CpG sites other than those investigated, including those outside of the promoter/enhancer region, might contribute to variability perhaps through effects on unrecognized regulatory elements.
Conclusion
The results of this study demonstrate interindividual variability in UGT1A1 5'-enhancer CpG methylation in normal human liver, and a positive correlation between −4 CpG methylation and UGT1A1 phenotype (after accounting for UGT1A1*28 and alcohol effects). Further work is needed to confirm these findings and understand the mechanisms underlying this association.
Declarations
Acknowledgements
The study was funded by NIH-R01-GM061834 (to M.H.C.). The Liver Tissue and Cell Distribution System provided the human liver tissues (Minneapolis, Minnesota) with funding by NIH Contract #N01-DK-7-0004/HHSN267200700004C. U.Y. was supported by the Higher Education Council of Turkey (2011). C.G. was funded by the Canadian Institutes of Health Research (MOP-42392) and Canada Research Chair Program. The content is solely the responsibility of the authors and does not necessarily represent the official views of the funding organizations.
References
- Court MH. Interindividual variability in hepatic drug glucuronidation: studies into the role of age, sex, enzyme inducers, and genetic polymorphism using the human liver bank as a model system. Drug Metab Rev 2010; 42: 209–224. [DOI] [PMC free article] [PubMed] [Google Scholar]
- Girard H et al. UGT1A1 polymorphisms are important determinants of dietary carcinogen detoxification in the liver. Hepatology 2005; 42: 448–457. [DOI] [PubMed] [Google Scholar]
- Court MH et al. Quantitative distribution of mRNAs encoding the 19 human UDP-glucuronosyltransferase enzymes in 26 adult and 3 fetal tissues. Xenobiotica 2012; 42: 266–277. [DOI] [PubMed] [Google Scholar]
- Kwara A et al. Interindividual variability in pharmacokinetics of generic nucleoside reverse transcriptase inhibitors in TB/HIV-coinfected Ghanaian patients: UGT2B7*1c is associated with faster zidovudine clearance and glucuronidation. J Clin Pharmacol 2009; 49: 1079–1090. [DOI] [PMC free article] [PubMed] [Google Scholar]
- Court MH et al. Interindividual variability in acetaminophen glucuronidation by human liver microsomes: identification of relevant acetaminophen UDP-glucuronosyltransferase isoforms. J Pharmacol Exp Ther 2001; 299: 998–1006. [PubMed] [Google Scholar]
- Girard H et al. The novel UGT1A9 intronic I399 polymorphism appears as a predictor of 7-ethyl-10-hydroxycamptothecin glucuronidation levels in the liver. Drug Metab Dispos 2006; 34: 1220–1228. [DOI] [PubMed] [Google Scholar]
- Krishnaswamy S et al. UDP glucuronosyltransferase (UGT) 1A6 pharmacogenetics: II. Functional impact of the three most common nonsynonymous UGT1A6 polymorphisms (S7A, T181A, and R184S). J Pharmacol Exp Ther 2005; 313: 1340–1346. [DOI] [PubMed] [Google Scholar]
- Krishnaswamy S et al. UDP glucuronosyltransferase (UGT) 1A6 pharmacogenetics: I. Identification of polymorphisms in the 5'-regulatory and exon 1 regions, and association with human liver UGT1A6 gene expression and glucuronidation. J Pharmacol Exp Ther 2005; 313: 1331–1339. [DOI] [PubMed] [Google Scholar]
- Court MH et al. UDP-glucuronosyltransferase (UGT) 2B15 pharmacogenetics: UGT2B15 D85Y genotype and gender are major determinants of oxazepam glucuronidation by human liver. J Pharmacol Exp Ther 2004; 310: 656–665. [DOI] [PubMed] [Google Scholar]
- Iyer L et al. Genetic predisposition to the metabolism of irinotecan (CPT-11). Role of uridine diphosphate glucuronosyltransferase isoform 1A1 in the glucuronidation of its active metabolite (SN-38) in human liver microsomes. J Clin Invest 1998; 101: 847–854. [DOI] [PMC free article] [PubMed] [Google Scholar]
- Miners JO et al. Genetic polymorphisms of UDP-glucuronosyltransferases and their functional significance. Toxicology 2002; 181–182: 453–456. [DOI] [PubMed] [Google Scholar]
- Iyer L et al. Phenotype-genotype correlation of in vitro SN-38 (active metabolite of irinotecan) and bilirubin glucuronidation in human liver tissue with UGT1A1 promoter polymorphism. Clin Pharmacol Ther 1999; 65: 576–582. [DOI] [PubMed] [Google Scholar]
- Court MH. Isoform-selective probe substrates for in vitro studies of human UDP-glucuronosyltransferases. Methods Enzymol 2005; 400: 104–116. [DOI] [PubMed] [Google Scholar]
- Zhou J et al. Correlation between bilirubin glucuronidation and estradiol-3-gluronidation in the presence of model UDP-glucuronosyltransferase 1A1 substrates/inhibitors. Drug Metab Dispos 2011; 39: 322–329. [DOI] [PMC free article] [PubMed] [Google Scholar]
- Senafi SB et al. Investigation of the substrate specificity of a cloned expressed human bilirubin UDP-glucuronosyltransferase: UDP-sugar specificity and involvement in steroid and xenobiotic glucuronidation. Biochem J 1994; 303(Pt 1): 233–240. [DOI] [PMC free article] [PubMed] [Google Scholar]
- Costa E. Hematologically important mutations: bilirubin UDP-glucuronosyltransferase gene mutations in Gilbert and Crigler-Najjar syndromes. Blood Cells Mol Dis 2006; 36: 77–80. [DOI] [PubMed] [Google Scholar]
- Palomaki GE et al. Can UGT1A1 genotyping reduce morbidity and mortality in patients with metastatic colorectal cancer treated with irinotecan? An evidence-based review. Genet Med 2009; 11: 21–34. [DOI] [PMC free article] [PubMed] [Google Scholar]
- Iyer L et al. UGT1A1*28 polymorphism as a determinant of irinotecan disposition and toxicity. Pharmacogenomics J 2002; 2: 43–47. [DOI] [PubMed] [Google Scholar]
- Rodriguez-Paredes M, Esteller M. Cancer epigenetics reaches mainstream oncology. Nat Med 2011; 17: 330–339. [DOI] [PubMed] [Google Scholar]
- Belanger AS et al. Regulation of UGT1A1 and HNF1 transcription factor gene expression by DNA methylation in colon cancer cells. BMC Mol Biol 2010; 11: 1–11. [DOI] [PMC free article] [PubMed] [Google Scholar]
- Gagnon JF et al. Irinotecan inactivation is modulated by epigenetic silencing of UGT1A1 in colon cancer. Clin Cancer Res 2006; 12: 1850–1858. [DOI] [PubMed] [Google Scholar]
- Court MH et al. Stereoselective conjugation of oxazepam by human UDP-glucuronosyltransferases (UGTs): S-oxazepam is glucuronidated by UGT2B15, while R-oxazepam is glucuronidated by UGT2B7 and UGT1A9. Drug Metab Dispos 2002; 30: 1257–1265. [DOI] [PubMed] [Google Scholar]
- Krishnaswamy S et al. Validation of serotonin (5-hydroxtryptamine) as an in vitro substrate probe for human UDP-glucuronosyltransferase (UGT) 1A6. Drug Metab Dispos 2003; 31: 133–139. [DOI] [PubMed] [Google Scholar]
- Krishnaswamy S et al. Evaluation of 5-hydroxytryptophol and other endogenous serotonin (5-hydroxytryptamine) analogs as substrates for UDP-glucuronosyltransferase 1A6. Drug Metab Dispos 2004; 32: 862–869. [DOI] [PubMed] [Google Scholar]
- Enoru-Eta J et al. Development of a UGT1A1 reporter gene assay for induction studies: correlation between reporter gene data and regulation of UGT1A1 in human hepatocytes. Drug Metab Lett 2010; 4: 31–38. [DOI] [PubMed] [Google Scholar]
- Leakey TI et al. A simple algorithm for quantifying DNA methylation levels on multiple independent CpG sites in bisulfite genomic sequencing electropherograms. Nucleic Acids Res 2008; 36: e64. [DOI] [PMC free article] [PubMed] [Google Scholar]
- Takahashi Y et al. Upstream stimulatory factor 1 (USF1) suppresses induction of CYP1A1 mRNA by 3-methylcholanthrene (MC) in HepG2 cells. Biochem Biophys Res Commun 1997; 240: 293–297. [DOI] [PubMed] [Google Scholar]
- Li W, Liu M. Distribution of 5-hydroxymethylcytosine in different human tissues. J Nucleic Acids 2011; 2011: 1–5. [DOI] [PMC free article] [PubMed] [Google Scholar]
- Kelavkar UP et al. DNA methylation paradigm shift: 15-lipoxygenase-1 upregulation in prostatic intraepithelial neoplasia and prostate cancer by atypical promoter hypermethylation. Prostaglandins Other Lipid Mediat 2007; 82: 185–197. [DOI] [PubMed] [Google Scholar]
- Togawa H et al. Induction of human UGT1A1 by bilirubin through AhR dependent pathway. Drug Metab Lett 2008; 2: 231–237. [DOI] [PubMed] [Google Scholar]
- Oakes CC et al. Evaluation of a quantitative DNA methylation analysis technique using methylation-sensitive/dependent restriction enzymes and real-time PCR. Epigenetics 2006; 1: 146–152. [DOI] [PubMed] [Google Scholar]
- Talens RP et al. Variation, patterns, and temporal stability of DNA methylation: considerations for epigenetic epidemiology. FASEB J 2010; 24: 3135–3144. [DOI] [PubMed] [Google Scholar]