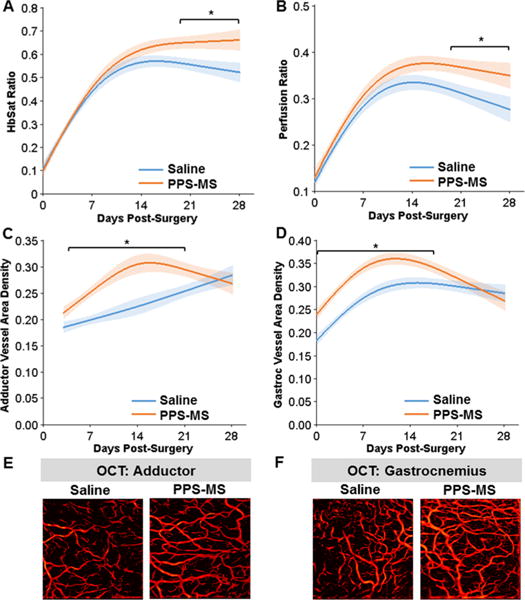
Figure 6.

HbSat, perfusion, and vessel density were increased in the ischemic limb of diabetic mice treated with PPS-MS. (A) Analysis of the GLM curves for the HbSat response showed a significantly greater HbSat ratio for the PPS-MS treated group for days 19–28. (B) Analysis of the GLM curves for the perfusion ratio showed a significant difference between the two treatment groups for days 19–28. (C–F) Vessel morphology parameters were quantified from OCT images of the adductor and gastrocnemius muscle regions. Analysis of the GLM curves for vessel area density shows that the two groups differ significantly (C) from days 4–21 in the adductor and (D) from days 0–17 in the gastrocnemius. (E, F) OCT images of the vasculature from Day 7 (images are projections of all vessels present in a volume acquired over a 4 mm × 4 mm area). (*p < 0.05, n = 17–20/group for days 0–7 and n = 6–7/group for days 14–28.).
