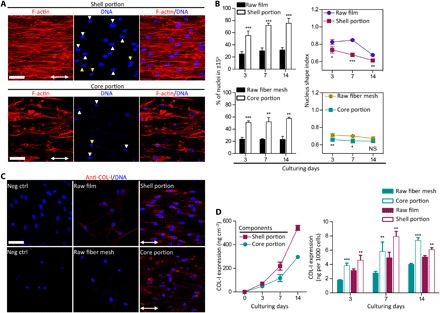
Fig. 3. Instructive nucleus deformation and tenogenic matrix expression in the tendon scaffold.

(A) Representative confocal fluorescence images of human tenocytes that show cytoskeletal organization and nucleus morphology in the tendon scaffolds after 14 days of culturing. Red, F-actin; blue, DNA. White arrowhead, nucleus distortion along central fibers; yellow arrowhead, nucleus distortion away from central fibers; double-headed arrow, scaffold longitudinal axis. Scale bars, 50 μm. (B) Nucleus alignment and elongation analysis of human tenocytes that is described as percent number of nuclei with angles in ±15° and nucleus shape index (NSI), respectively. Cells cultured in the shell and core portions of the tendon scaffold obtain higher efficiencies of nucleus alignment and elongation than controls. (n = 3; *P < 0.05, **P < 0.01, ***P < 0.001, and NS P > 0.05 based on Student’s paired t test with two-tailed distribution). Error bars represent SD. (C) Representative confocal fluorescence images of human tenocytes that express elevated collagen type I (COL-I) (the major tendon matrix protein) in the tendon scaffold shell (versus control of original film tube) and core (versus control of original fiber mesh roll) portions. Red, COL-I; and blue, DNA. Double-headed arrow, scaffold longitudinal axis. Neg ctrl, negative control. Scale bar, 50 μm. (D) Quantitative measurement of COL-I that shows lasting secretion for human tenocytes in the tendon scaffold, at up-regulated levels than controls. Original film tube, control of the shell portion; original fiber mesh roll, control of the core portion. (n = 4; **P < 0.01 and ***P < 0.001 based on Student’s paired t test with two-tailed distribution). Error bars represent SD.
