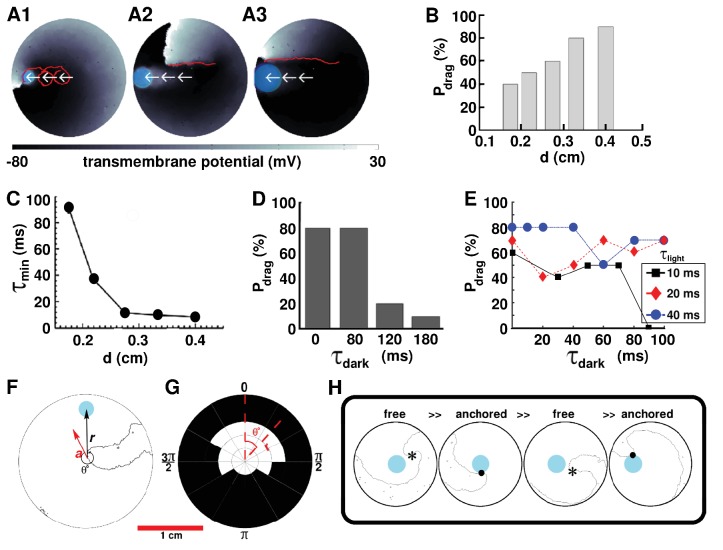
Figure 3. AAD control by continuous illumination of circular light spots of different sizes and durations.
Panel A shows representative dragging events as a spiral wave core is relocated from the center of the simulation domain to the periphery, with light spots of diameter =, and cm, respectively. In each case, the real trajectories of the spiral tip is marked with solid red lines on top of the voltage map. When is large, the spiral tip exhibits a tendency to move along a linear path, as opposed to the cycloidal trajectory at small . With , (B) probability of successful dragging () increases, and (C) spiral core relocation time () decreases, with increasing . In each of the afore-mentioned cases, the dragging process is illustrated with zero dark interval () and minimal light interval (). (D) With finite non-zero , increases with shortening of , for light stimulation of afixed cycle length ( ms). (E) Dependence of on , for three different light intervals (). (F) Schematic representation of the drag angle and the distance () between the starting location of the spiral tip and the location of the applied light spot. (G) Distribution of at different and , thresholded at 50%. (H) AAD control is effectuated by alternate transitions between functional (free wave) and anatomical (anchored wave) reentry. The phase singularity of the free spiral is marked with a black asterisk, whereas, the point of attachment of the anchored wave to the heterogeneity is marked with a black dot.

