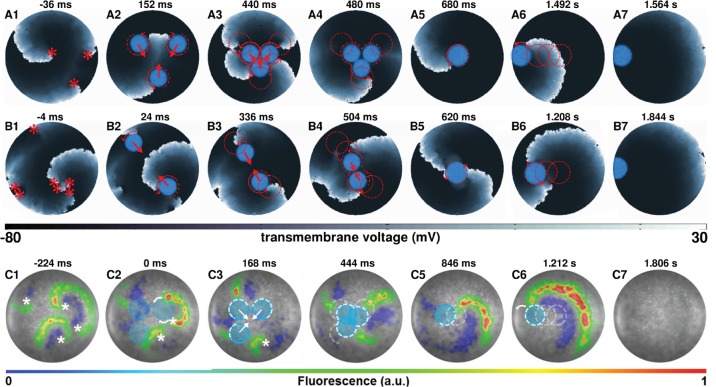
Figure 5. AAD control of multiple spiral wave cores in favor of termination of complex reentrant patterns.
Panels (A) and (B) show representative in silico voltage maps of the drag-to-termination process for stable reentrant activity with three and seven phase singularities, respectively. Panel (C) shows representative in vitro voltage maps of the drag-to-termination process for stable reentrant activity with four phase singularities. Number and the position of the light spots, indicated with blue filled circles, are strategically applied to first capture the existing spiral waves, and then drag them to termination, following the same principle as in Figure 2 (A5-6) and (B5-6). In the process, it is possible to reduce the complexity of the reentrant pattern through annihilation of some of the existing phase singularities by new waves emerging from the location of the applied light spot. The schematic movement of the tip of the spiral wave, as it is anchored to the location of the light spot at previous time points, is indicated by means of dashed red (white) lines in silico (in vitro), and the direction of dragging is illustrated with red (white) arrows. Video 4 shows a video of computer simulations demonstrating AAD control of complex reentrant patterns with three and four spiral waves, in favor of their eventual termination. Video 5 shows the same process, in vitro, but for stable reentry with four-phase singularities. (Time t = denotes the moment when the light is applied).

