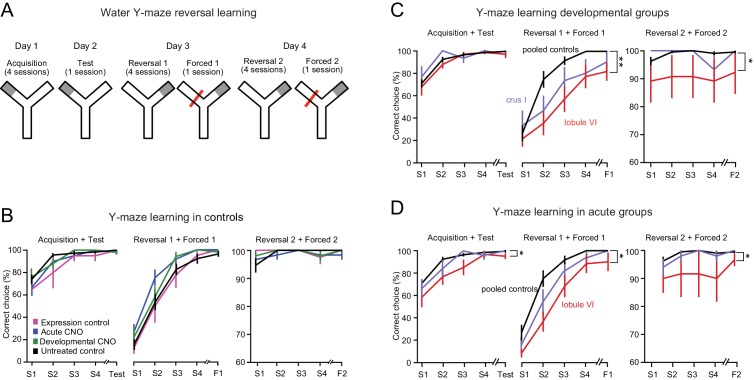
Figure 4. Impairment of swimming Y-maze reversal learning.
(A) Protocol for the Y-maze reversal assay consisting of initial training (day 1), test (day 2), and reversal (days 3 and 4). (B) All control groups showed normal reversal learning. Data represent averages of all control mice segregated by the type of controls. (C) Reversal learning was impaired by developmental activation of DREADDs in lobule VI and crus I but not in control mice (see Figure 4—figure supplement 1 and Videos 4 and 5). (D) Reversal learning was impaired by acute activation of DREADDs in lobule VI. Data with error bars are plotted as mean ±SEM. *p<0.05; **p<0.01.
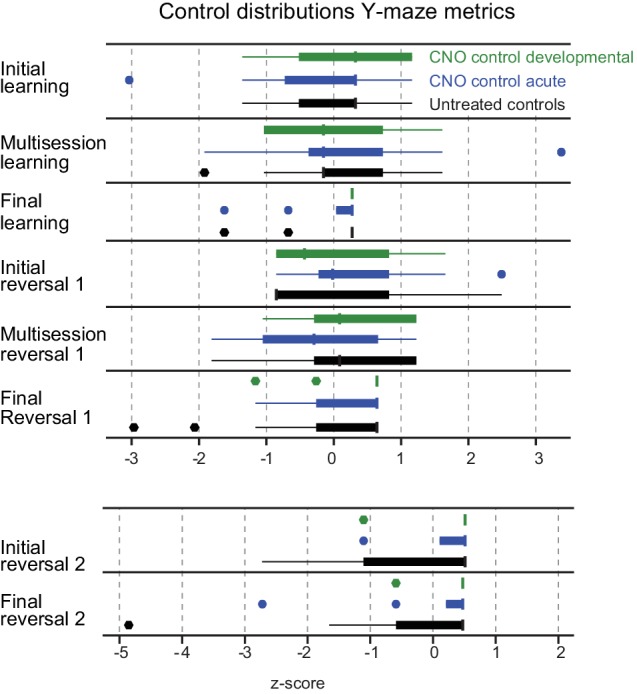
Figure 4—figure supplement 1. Control distributions of y-maze metrics.


