. 2018 Sep 20;7:e36401. doi: 10.7554/eLife.36401

Figure 6. Cerebellar developmental impairment in a three-chamber social preference task.

(A) The three-chamber social preference test. (B) Interaction times with under-cup mouse and object were quantified using automated detection of near-cup approaches (see Figure 6—figure supplement 1). (C) Specific impairments in social preference after developmental perturbation of crus I or crus II but not other lobules, as measured by both time spent anywhere in the chamber and time spent near the cup. Error bars indicate mean ±SD. (D) Variance in social behavior metrics points to a stronger effect of cerebellar perturbation on non-motor metrics than on movement. (E) Separation of individual mice according to principal component analysis (see Figure 6—figure supplement 2). Orange curves indicate a boundary between opposite effects in acutely and developmentally perturbed lobule VII mice. Individual behavioral metrics were insufficient to separate the two groups (see Figure 6C). *p<0.05; **p<0.01; ***p<0.001.

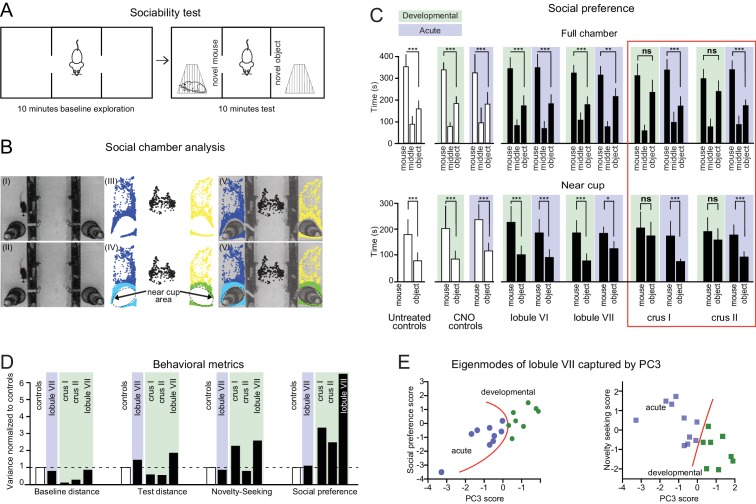
Figure 6.

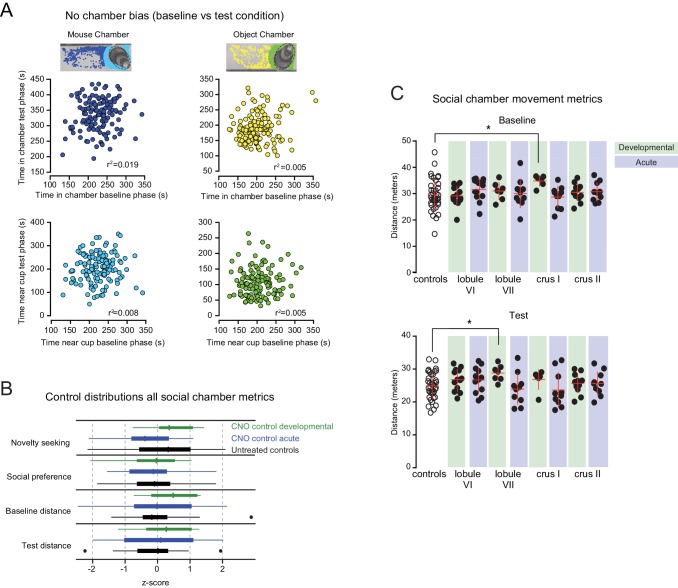
Figure 6—figure supplement 1. Social chamber metrics.

Figure 6—figure supplement 1.

(A) Lack of correlation between test phase bias and baseline bias, indicating the lack of identifiable environmental influence. (B) No differences were detected in distributions of the three z-score-normalized control groups for any social chamber assay measures (as defined in Table 2). Plotted outliers were defined as points outside the interquartile range (IQR) by more than 1.5 IQR. (C) Movement in social chamber, measured by distance traveled, was assessed during baseline and test phases. Crus I developmental mice displayed increased distance traveled compared to controls in baseline. In the test phase, lobule VII developmental mice displayed increased distance traveled compared to controls. No other differences were detected.
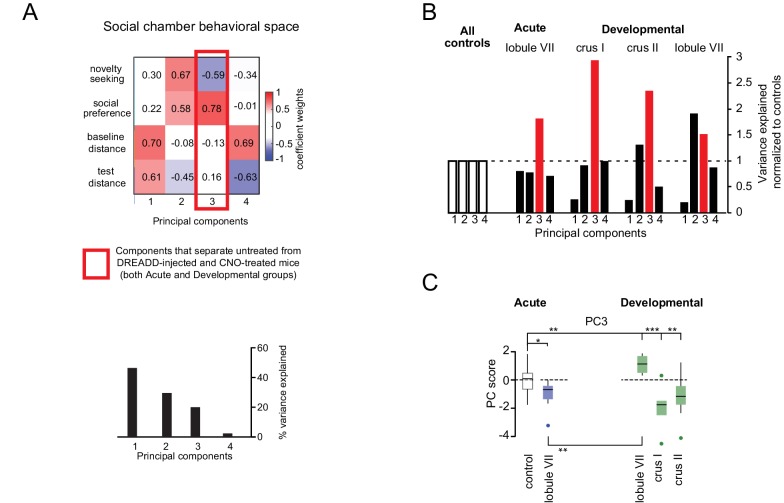
Figure 6—figure supplement 2. Social chamber principal component analysis.

Figure 6—figure supplement 2.

(A) Control-group principal components of social chamber assay measures (as defined in Table 2). The red outline indicates the one eigenbehavior (PC3), representing strong negative covariation of social preference and novelty-seeking, which was significantly affected by lobule-specific perturbations. (B) Variance contribution of lobule-specific PCs, normalized to controls. (C) Mouse-by-mouse z-scored contributions from PC3 showing statistically significant separation between controls and lobule VII, crus I, and crus II developmental perturbation. *p<0.05; **p<0.01; ***p<0.001.